Here is your Bonus Idea with links to the full Top Ten:
DuPont (NYSE:DD) has been making chemicals for a long time. The sign above gives you a bit of perspective into this. Chemistry in the 1920s. But he company was supplying the US Government with gun powder during the War of 1812, over 100 years before that. The stock has been a staple of income portfolios as well with a steady solid 2.2% dividend yield.
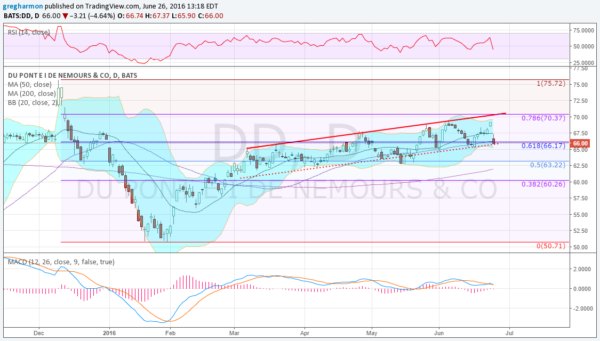
The chart below shows that it has had some good and bad points over the last 7 months. After making a higher over 75 in December it sold off nearly 33% to a low near 50 in January. That is a big fast move for a $57 billion company. Since that low the stock has made steady progress higher. After a quick first month pop, it has settled into a steady move higher against trend resistance and, but for a couple of days, trend support.
It was moving higher towards that resistance when the Brexit decision brought the market down and DuPont with it. The drop brought the price back to that trend support. It also brought the momentum indicators to important levels. The RSI broke down though the mid line and the MACD crossed down. Both are still in the bullish zone, but near the edge. An inflection zone.
A break of the channel to the downside sees possible support lower at 62.85 and 60.50 followed by 57.50 and 56. A bounce off of support might find resistance above at 67.50 and 69 before 70.40 and 75.72. Short interest is low under 1% and the company is expected to report earnings next July 26th.
The options chain for this week shows not much open interest, but what there is is focused lower from 64 to 65. For the July monthly options it is spread pretty evenly with size at 65 and 62.5 on the Put side ad 67.5, 70 and 72.5 on the Call side. The July 29 Expiry options, the first beyond the earnings report show the at-the-money straddle pricing a $4.50 move, and most notable very large open interest at the 72.5 Strike.
duPont, Ticker: DD
Trade Idea 1: Buy the stock on a move higher with a stop at 65.50.
Trade Idea 2: Buy the stock on a move higher and add a July 29 Expiry 66/62 Put Spread ($1.84) and sell the August 70 Covered Calls (85 cent credit).
Trade Idea 3: Buy the July 62.5/67.5 Bullish Risk Reversal (63 cents).
Trade Idea 4: Sell the stock short on a move under 65.50 with a stop at 66.50.
After reviewing over 1,000 charts, I have found some good setups for the week. These were selected and should be viewed in the context of the broad Market Macro picture reviewed Friday which saw the week marked by the Cavaliers winning the NBA title, and the Summer solstice ushering in the new season, with all well early in the week, then the Brexit vote changed all that as the equity markets, and all other markets dumped Friday. Leave it to the Brits to screw up a great week (just kidding). With a one day turn now equities look weak.
Elsewhere look for gold to continue higher while crude oil consolidates with a pullback in the uptrend. The US Dollar Index remains stuck in a sideways consolidation while US Treasuries are moving back higher. The Shanghai Composite and Emerging Markets are stuck in consolidative ranges with the Chinese market biased to break the range to the upside while Emerging Markets are biased to break theirs lower.
Volatility looks to remain elevated in the coming week keeping the bias lower for the equity index ETFs SPY (NYSE:SPY), NYSE:IWM and NASDAQ:QQQ. Their charts all look better to the downside in the short term, with the QQQ at intermediate support and the SPY breaking its intermediate support. All 3 printed possible reversal candles though so stay nimble. Use this information as you prepare for the coming week and trad’em well.
Disclaimer: The information in this blog post represents my own opinions and does not contain a recommendation for any particular security or investment. I or my affiliates may hold positions or other interests in securities mentioned in the Blog. Please see my Disclaimer page for my full disclaimer.
