Here is your Bonus Idea with links to the full Top Ten:
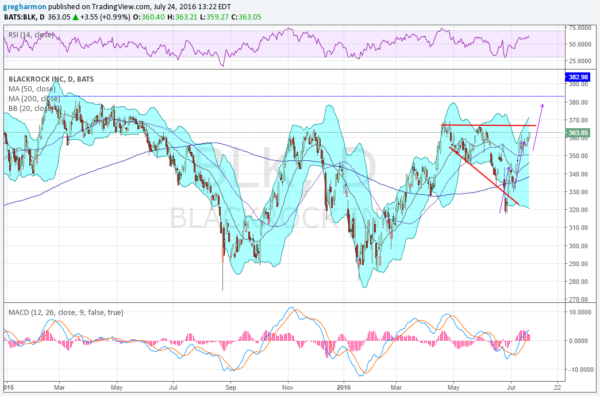
Blackrock (NYSE:BLK), stock went through a big ‘W’ from its high in February 2015 to the April high. Great action for channel traders, not so great for long term investors. Since April it has been building an expanding wedge. It broke the wedge to the downside following the Brexit vote but recovered quickly. Now it is heading back to short term resistance and the top of the 18 month range.
The Bollinger Bands are open to the upside to allow a continuation higher. The RSI is bullish and rising too. And the MACD is positive and rising. A trifecta of indicators pointing higher. There are two price targets to the upside from the patterns shown. First the break of the wedge would give a target to 400. The 3 Drives looks for the 3rd leg to extend to 380. Both are good upside short term.
The August options chain shows some open interest below the current price on the Put side. On the Call side it is very focused from 360 to 370. October options, the first beyond the next earnings report in September, look similar, but with a longer tail to the upside on the calls.
Blackrock, Ticker: BLK

For the Short Term Trader
Trade Idea 1: Buy the stock on a break over 365 with a stop at 360 and sell the August 370 Calls ($3.30). As an alternative buy the August 360 Calls ($8.90).
For the Intermediate Trader
Trade Idea 2: Buy the September 360/380 Call Spread ($8.95) and sell the August 370 Calls ($3.30). As an alternative Buy the stock over 365 and sell the August 370 Calls ($3.30) and after they expire sell the September 380 Calls ($2.65).
For the Long Term Trader
Trade Idea 3: Buy the January 2018 Expiry 380 Calls (27.60) and start a process of selling each monthly Call against it. Start with the August 370 calls. When they expire sell the September 380 Calls and continue until January 2018 moving the strikes with the movement in the stock and open interest. Alternatively buy the stock and sell August Covered Calls and then resell covered calls monthly afterwards.
You may have noticed that this is in fact the same strategy in all 3 traders. The only difference is that the long term trader is letting the trade play out over more time. Which are you?
After reviewing over 1,000 charts, I have found some good setups for the week. These were selected and should be viewed in the context of the broad Market Macro picture reviewed Friday which heading into the last week of July finds the weather is hot and so are the Equity markets.
Elsewhere look for Gold continue to consolidate the pullback in its uptrend while Crude Oil moves lower in its uptrend. The US Dollar Index looks to continue to move higher in its broad 18 month consolidation while US Treasuries consolidate in their uptrend. The Shanghai Composite looks to drift sideways with an upward bias and Emerging Markets may need to consolidate further before assaulting long term resistance.
Volatility looks to remain at abnormally low levels keeping the bias higher for the equity index ETF’s SPDR S&P 500 (NYSE:SPY), iShares Russell 2000 (NYSE:IWM) and PowerShares QQQ Trust Series 1 (NASDAQ:QQQ). The QQQ looks the strongest and ready for more upside on both timeframes. The SPY and IWM look a bit extended on the longer timeframe with the IWM consolidating on the short timeframe and the SPY looking to move higher. Use this information as you prepare for the coming week and trad’em well.
