Here is your Bonus Idea with links to the full Top Ten:
3M (N:MMM) started its life in 1902 as Minnesota Manufacturing and Mining. It now sports $30 billion in annual sales and has over 88,000 employees worldwide making 55,000 products, including some shown above. From mining to Post It notes. Who would have guessed.
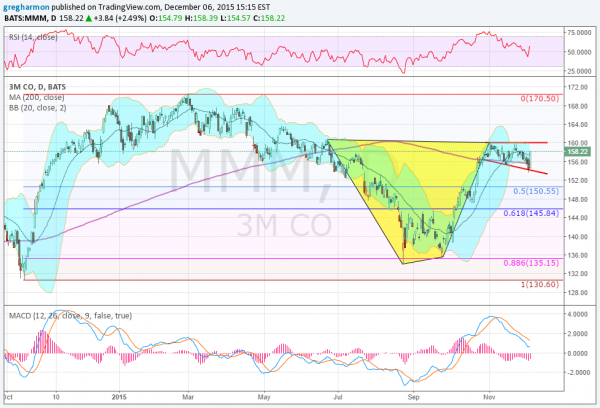
The stock price has had a rough time in 2015, falling from a high over 170 to start March to a low with the hard market sell off on August 24th at 135. That retraced 88.6% of the move higher from the October 2014 low.
Since then, it has found support and rose back to 160. That has acted as resistance since the beginning of November. This fall and recovery followed by consolidation has created a Cup and Handle pattern. A break over 160 would target a move to 185 out of the pattern.
The momentum indicators are mixed. The RSI is bullish and turned back higher, supporting the upside. But the MACD is falling, with maybe a hint of a reversal Friday. Short interest is low at 1.4%. Resistance higher comes at 160 and then 163.60 and 167.70 before the prior top at 170.50. Support lower comes at 155.85 and 154.25 before 152.30 and 148.60.
The options chains show this week with larger open interest on the call side and above from 157.5 to 170. There is smaller size in puts from 152.5 to 160. In December monthly the biggest open interest is at 150 below on the put side and then 160 on the call side. January monthly options see big open interest from below 110 to 160 evenly spread on the put side and then focused from 145 to 175 in a bell curve shape centered on 160 to 165 on the call side. The company reports earnings next January 28, 2016.
3M, Ticker: MMM
Trade Idea 1: Buy the stock on a move over 160 with a stop at 155, or more aggressively now (158.22 Friday close) with a stop at 154.
A straight stock trade.
Trade Idea 2: Buy the December 157.5 Calls (offered at $2.65 late Friday) on the same trigger.
A defined risk way to trade the stock.
Trade Idea 3: Buy the January 160 Calls ($2.59) and sell the January 150 Puts ($1.16) for a bullish Risk Reversal.
A longer term high leverage trade using little capital.
After reviewing over 1,000 charts, I have found some good setups for the week. These were selected and should be viewed in the context of the broad Market Macro picture reviewed Friday which, heading into next week sees the equity markets looking mixed in the short run and at resistance, while better in the intermediate term.
Elsewhere look for gold to continue the bounce in its downtrend while crude oil continues lower. The US dollar index is biased lower in the short term in its uptrend while US Treasuries look lower in the broad consolidation.
The Shanghai Composite looks better to the upside, but with resistance nearby, while Emerging Markets are biased to the downside. Volatility looks to remain subdued, keeping the bias higher for the equity index ETFs N:SPY, N:IWM and O:QQQ. Short term, the QQQ looks best and ready to challenge the all-time high while the SPY and IWM lag. Longer term they are all at prior consolidation areas and need a catalyst.
After a week where the ECB disappointed, the FOMC is pushing hard with rhetoric it will tighten, that the equity indexes did not crater can also be viewed as strength. Use this information as you prepare for the coming week and trad’em well.
Disclaimer: The information in this blog post represents my own opinions and does not contain a recommendation for any particular security or investment. I or my affiliates may hold positions or other interests in securities mentioned in the Blog. Please see my Disclaimer page for my full disclaimer.
