Here is your Bonus Idea with links to the full Top Ten:
Procter & Gamble, N:PG, was founded almost 180 years ago, 5 hours down the road in Cincinnati Ohio. They started out making candles and soap. Now they have more than 80 brands, despite a streamlining in August 2014 that cut about 100 brands. They focus mainly on Beauty and Family care and cleaning products now and have sales of over $80 billion annually.
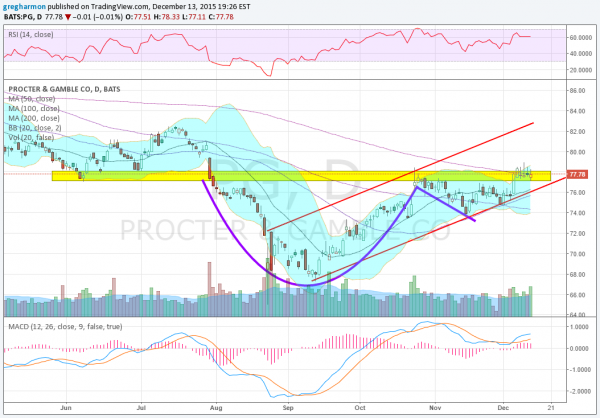
The stock has had a lackluster 2015 falling from a high near 90 to start the year to the August low at 66. But since then it has trended higher. The chart shows a rising channel and the price currently at resistance near 77, a price that has been important several times in the past 6 months.
A move over that resistance would target a run higher toward the top of the channel. It would carry a Measured Move to 80, which would fill a gap from July. But it would also mark continuation in the Cup and Handle towards the target of 88. Resistance above stands at 78.50 and 79.50 followed by 81 and 82.50 before 84 and 85 then 87 and a gap to fill to 88.75 before 91.50. Support lower comes at 76.65 and 74.70 followed by 73.60 and 71.50 before 69.50 and 67.70.
The momentum indicators support more upside. The RSI is bullish and rising and the MACD is also rising and positive. The Bollinger Bands® are also opening and shifting up. Short interest is low at less than 1% and the company is expected to report earnings next January 26, 2016.
Looking at the options chain this week shows large open interest at 77.5, right where the current price is, and the 75 below and 80 above. Potential for a 77.5 pin this week. The January chain shows the call side concentrated from 75 to 80 and then falling off up to 90. The Put side is biggest at 75 but spread from 80 to 65 and lower. January 29 Expiry options just started trading so there is little open interest. We need to look at February to get a read on earnings positioning. These show a downward bias with 75 to 80 biggest on the Call side but 72.5 to 75 on the Put side.
Procter & Gamble

Trade Idea 1: Buy the stock on a move over 78.50 with a stop at 74.50.
A straight stock trade.
Trade Idea 2: Buy the stock and add a January 29 Expiry 77.5/75 Put Spread/80 Covered Call adding 11 cents.
Adding a collar for downside protection.
Trade Idea 3: Buy the January 22 Expiry 77.50 Calls for $1.94.
A Defined risk method for participating in upside until earnings.
Trade Idea 4: Buy the January 22 Expiry 77.50/December 31 Expiry 80 Call Diagonal for $1.50.
Reduces the cost of the levered option trade with the possibility to roll short calls higher later.
After reviewing over 1,000 charts, I have found some good setups for the week. These were selected and should be viewed in the context of the broad Market Macro picture reviewed Friday which, heading into Options Expiration Week, the last full week before Christmas and the FOMC meeting sees the equity markets looking weak in the short run and all but the O:QQQ tired or weak on the intermediate term.
Elsewhere look for gold to consolidate in it downtrend while crude oil runs lower. The US dollar index is back into consolidation with a short term downward bias while US Treasuries are biased higher in consolidation. The Shanghai Composite looks better to the downside short term in its bounce and Emerging Markets flat out broken and falling, but oversold.
Volatility looks to remain elevated keeping the bias lower for the equity index ETFs N:SPY, N:IWM and QQQ. Their charts look weak in the short term as well. In the intermediate term, the IWM is nearing key support, and the SPY testing a shift to a downside bias while the QQQ is still the strongest. Use this information as you prepare for the coming week and trad’em well.
Disclaimer: The information in this blog post represents my own opinions and does not contain a recommendation for any particular security or investment. I or my affiliates may hold positions or other interests in securities mentioned in the Blog. Please see my Disclaimer page for my full disclaimer.
