Aflac (NYSE:AFL) is known for their crazy commercials with a duck that quacks the company name. But if you did not know, they are the largest provider of supplemental insurance in the US. Nothing to quack at. They also provide 1-in-4 Japanese households with life insurance. Not bad for a company founded in Columbus, Georgia.
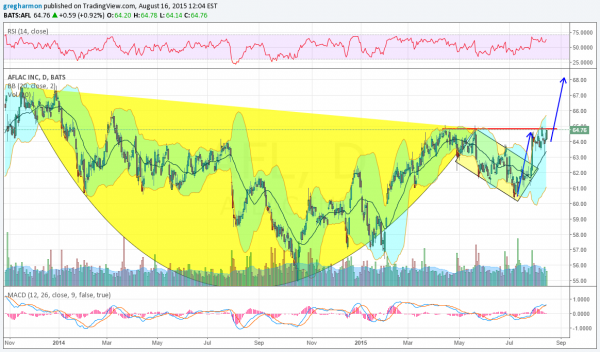
The stock price has benefited lately from a broad rise in the insurance sector since 2012. It has consolidated in a cup and handle formation since late 2013, and is triggering now. That pattern gives a target to 74.75. Shorter term it is consolidating in a bull flag with a target to 68 on a break to the upside.
The momentum indicators show a supportive environment for more upside with the RSI bullish and rising and the MACD positive. But with the MACD cross down it could be a bit better. There is support lower at 63.65 and 62.50 before 61.40 and 60.35. Resistance to the upside comes at 64.90 and the prior high at 67.50. Short interest is low at 1.2% and the company is expected to report next on October 27th.
Looking at the options chains the August expiry shows large open interest this week on the call side and between the 62.5 and 67.5 Strikes. There is a big open interest at the 47.5 strike on the put side that looks like it will not come into play. September open interest is not very big at this point, but favors the current area. Moving to the November strike—beyond earnings—shows the 65 to 70 strike range with large open interest on the call side and that same 47.5 put strike below big, too.

Trade Idea 1: Buy the stock on a move over 65 with a stop at 63.50.
A straight stock play.
Trade Idea 2: Buy the August 65 calls (offered at 26 cents late Friday) and sell the August 62.5 puts (10 cents) if you want leverage.
A short term leveraged trade with defined risk using just the calls, and more leverage with the puts added.
Trade Idea 3: Buy the September 60/65 bullish risk reversal (69 cents).
Give it more time, but stops prior to earnings.
Trade Idea 4: Buy the November 65/70 call spread ($1.55) and sell the November 62.5 put ($1.50).
A highly levered trade giving up some upside for a maximum levered return.
After reviewing over 1,000 charts, I have found some good setups for the week. These were selected and should be viewed in the context of the broad market macro picture reviewed Friday which, heading into August Options Expiration Week, sees the equity markets looking to consolidate in the short term and looking better long term.
Elsewhere look for gold to continue the bounce in its downtrend while crude oil just continues lower. The US Dollar Index seems content to move sideways, but with a short term downward bias while US Treasuries are biased higher. The Shanghai Composite looks to continue to consolidate in the longer uptrend while emerging markets look ugly with more downside to come.
Volatility looks to remain subdued keeping the bias higher for the equity index ETFs SPY, IWM and QQQ, despite their failure to move higher last week. Their charts show weakness continuing in the IWM and consolidation in the SPY and QQQ short term. All look better longer term with the QQQ strongest followed by IWM and then SPY. Use this information as you prepare for the coming week and trade ’em well.
Disclaimer: The information in this blog post represents my own opinions and does not contain a recommendation for any particular security or investment. I or my affiliates may hold positions or other interests in securities mentioned in the Blog, please see my Disclaimer page for my full disclaimer.
