Here is your Bonus Idea with links to the full Top Ten:
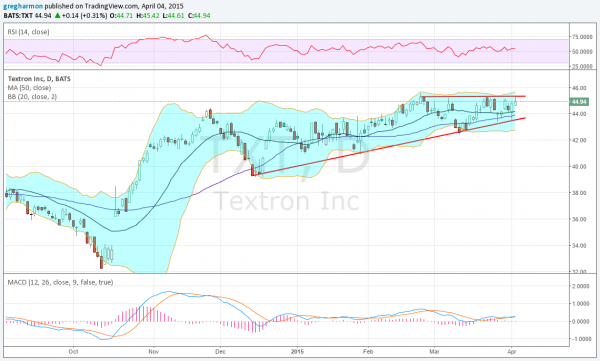
Textron (NYSE:TXT), had a hard move higher off of the bottom in October. But since November it has been hovering with a slight drift higher. The price has been making higher lows since October and created a rising trend support line since December. Since late February the stock has found resistance at 45.35, making an ascending triangle. A conservative target on a break higher would look for a move to 49.50.
The RSI is bullish and rising. The MACD is also rising, in support of more upside. The Bollinger Bands® are also opening to the upside. There is resistance higher at 45.35 and then 48.30 followed by 51.25 and 55.90 before 62.85, all from 2006 to 2008. Support lower comes at 43.50 and 42.50 followed by 40.10. Short interest is low under 2% and the company is expected to report earnings next April 28th before the open.
Textron, Ticker: NYSE:TXT
Trade Idea 1: Buy the stock on a move over 45.35.
A straight break out stock trade.
Trade Idea 2: Buy the April 45 Calls (offered at 76 cents late Thursday).
Using defined risk to trade the upside.
Trade Idea 3: Buy the May 42/45 bull Risk Reversal ($1.07).
Adds leverage and time for a great reward to risk.
Trade Idea 4: Buy the September 45/May 47 Call Diagonal ($2.10).
A time spread that can be adjusted to recover premium as it rises.
Trade Idea 5: Buy the September 45/May 47 Call Diagonal and sell the May 40 Put ($1.55).
Adds leverage and reduces cost for #4.
After reviewing over 1,000 charts, I have found some good setups for the week. These were selected and should be viewed in the context of the broad Market Macro picture reviewed Thursday which, heading into the first week of April the Equity markets are mixed with the ARCA:IWM strong but the ARCA:SPY and NASDAQ:QQQ weaker and maybe ready for some short term downside.
Elsewhere look for Gold to bounce around 1200 as it consolidates while Crude Oil churns back in its consolidation channel. The US Dollar Index should generally move sideways but with an upward bias while US Treasuries are biased lower short term in their consolidation. The Shanghai Composite looks very strong and Emerging Markets are getting jealous, and trying to join it to the upside.
Volatility looks to remain subdued keeping the bias higher for the equity index ETF’s SPY, IWM and QQQ. Their charts point to consolidation or even a downside bias for the SPY and QQQ, while the IWM seem the place to be, holding up well at the all-time highs. Use this information as you prepare for the coming week and trad’em well.
DISCLAIMER: The information in this blog post represents my own opinions and does not contain a recommendation for any particular security or investment. I or my affiliates may hold positions or other interests in securities mentioned in the Blog, please see my Disclaimer page for my full disclaimer.
