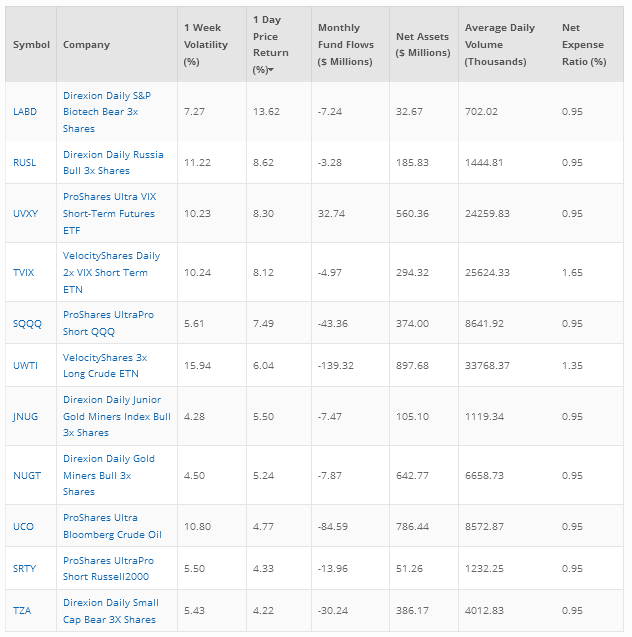
Top 10 ETF gainers with assets of more than $25 million as of Jan 27, 2016. (Leveraged)

- The Fund seeks daily investment results, before fees and expenses, of 300% of the inverse (or opposite) of the performance of the S&P Biotechnology Select Industry Index. The Index is provided by Standard & Poor s and includes domestic companies from the biotechnology industry. As of April 30, 2015, the Index was comprised of 98 stocks. The companies included in the Index have a median market capitalization of $1.54 billion and are concentrated in the energy and biotechnology sectors as of April 30, 2015.
- The Direxion Daily Russia Bull 3X Shares (N:RUSL) seeks daily investment results, before fees and expenses, of 300% of the price performance of the DAX global Russia Performance Index. The DAX Global Russia+ Index is an index comprised of the most liquid Russian ADRs/GDRs and local shares, screening for high liquidity only, and capping the number of securities at 45.
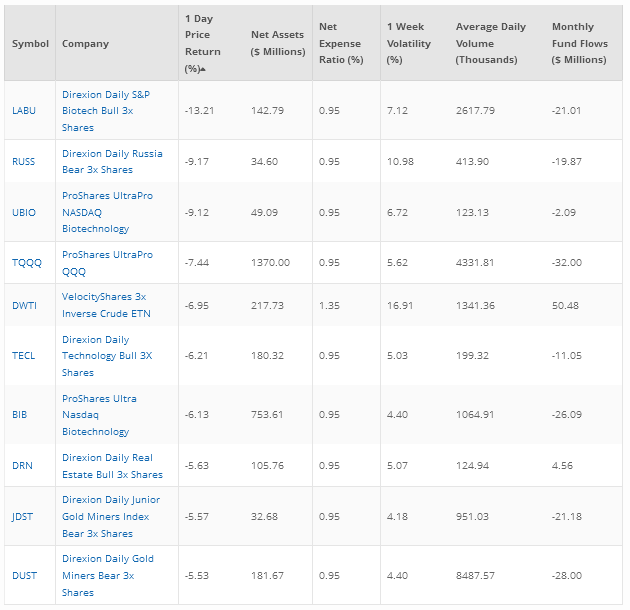
Top 10 ETF losers with assets of more than $25 million as of Jan 27, 2015
( Leveraged)

- The Fund seeks daily investment results, before fees and expenses, of 300% of the performance of the S&P Biotechnology Select Industry Index. The Index is provided by Standard & Poor s and includes domestic companies from the biotechnology industry. As of April 30, 2015, the Index was comprised of 98 stocks. The companies included in the Index have a median market capitalization of $1.54 billion and are concentrated in the energy and biotechnology sectors as of April 30, 2015.
- The Daily Russia Bear 3x Shares seeks daily investment results, before fees and expenses, of 300% of the inverse (or opposite) of the price performance of the DAX Global Russia+ Index. The DAX Global Russia+ Index is an index comprised of the most liquid Russian ADRs/GDRs and local shares, screening for high liquidity only, and capping the number of securities at 45.
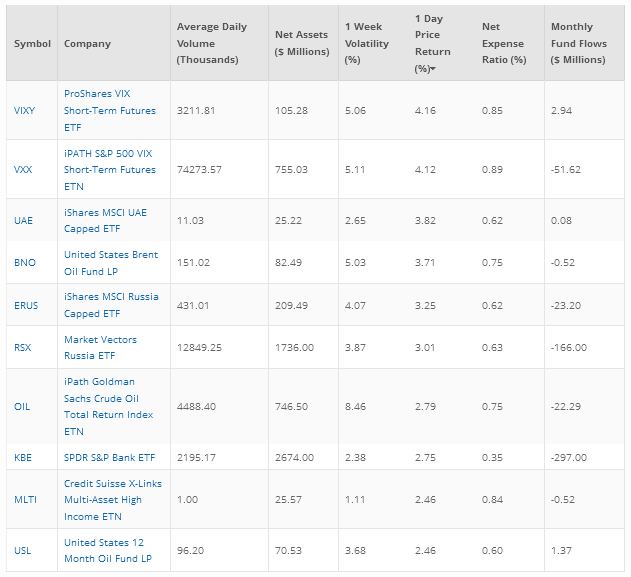
Top 10 ETF gainers with assets of more than $25 million as of Jan 27, 2016. (NO Leverage)

- The CBOE Volatility Index (VIX) is a widely followed measure of the expected volatility of the S&P 500. Since the VIX is not directly investable S&P 500 volatility exposure is often achieved through VIX futures. Each of the VIX futures indexes measures the movements of a combination of VIX futures and is designed to track changes in the expectation for VIX over a specific time window in the future. As a result the S&P 500 VIX Short-Term Futures Index and ProShares VIX Short-Term Futures (N:VIXY) can be expected to perform differently than the VIX.
- The S&P 500 VIX Short-Term Futures Index TR is designed to provide access to equity market volatility through CBOE Volatility Index (the “VIX Index”) futures. Specifically, the S&P 500 VIX Short-Term Futures Index TR offers exposure to a daily rolling long position in the first and second month VIX futures contracts and reflects the implied volatility of the S&P 500 Index at various points along the volatility forward curve. The index futures roll continuously throughout each month from the first month VIX futures contract into the second month VIX futures contract. A direct investment in VIX (commonly referred to as spot VIX) is not possible. The S&P 500 VIX Short-Term Futures Index TR holds VIX futures contracts, which could involve roll costs and exhibit different risk and return characteristics. Investments offering volatility exposure can have various uses within a portfolio including hedging, directional, or arbitrage strategies and are typically short or medium-term in nature.
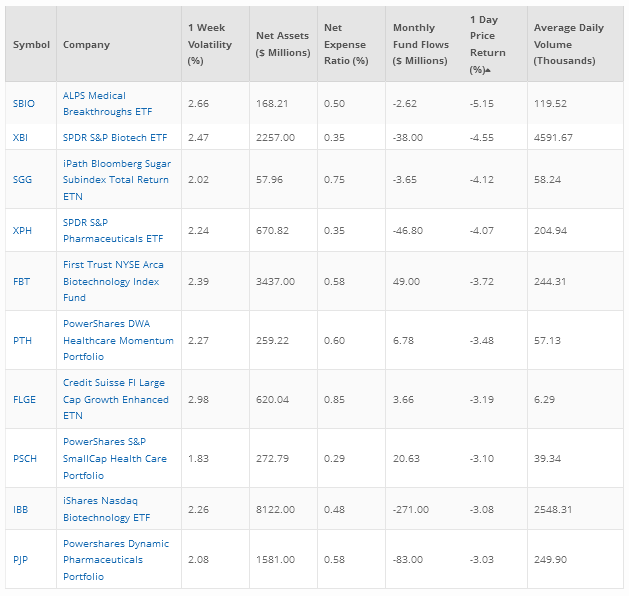
Top 10 ETF losers with assets of more than $25 million as of Oct 23, 2014. (No Leverage)

- The ALPS Medical Breakthroughs (N:SBIO) ETF invests in the public equity markets of the United States. It invests in the stocks of companies operating in the biotechnology and pharmaceutical sectors. The fund invests in stocks of mid cap and small cap companies with a market capitalization of no less than $200 million and no more than $5 billion. It seeks to replicate the performance of the Poliwogg Medical Breakthroughs Index, by investing in the stocks of companies as per their weightings in the index.
- The SPDR S&P Biotech (N:XBI) ETF before expenses seeks to closely match the returns and characteristics of the S&P Biotechnology Select Industry Index.
