Even in light of an extended bull market and despite the fact that the energy sector is roughly 50% above its 2016 low, overall the energy sector continues to be something of “laggard.”
Will that change? Of course it will, eventually. But let’s take a closer look at where things stand right now.
Figure 1 displays the growth of $1,000 invested in the S&P 500 Index (SPX) versus $1,000 invested in Fidelity Select Energy (FSENX) since it started trading in July 1981.
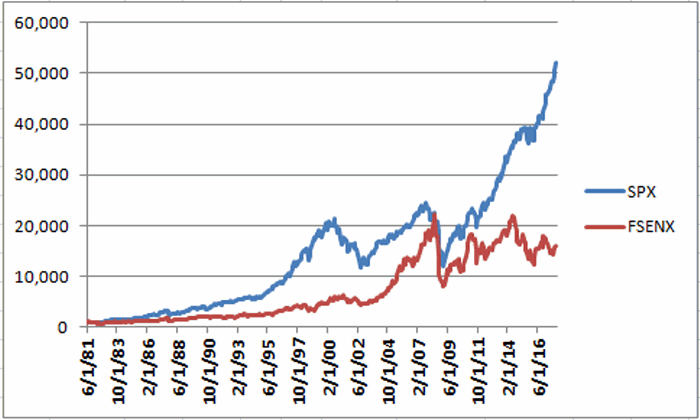
Figure 1 – Growth of $1,000 invested in SPX (blue) versus FSENX (red); 6/30/1981-11/30/2017
As you can see, at the moment the overall market as represented by SPX has far outpaced the energy sector. In fact the SPX has gained FSENX 3.2 times as much (+4,663% to +1,466%) over 36+ years.
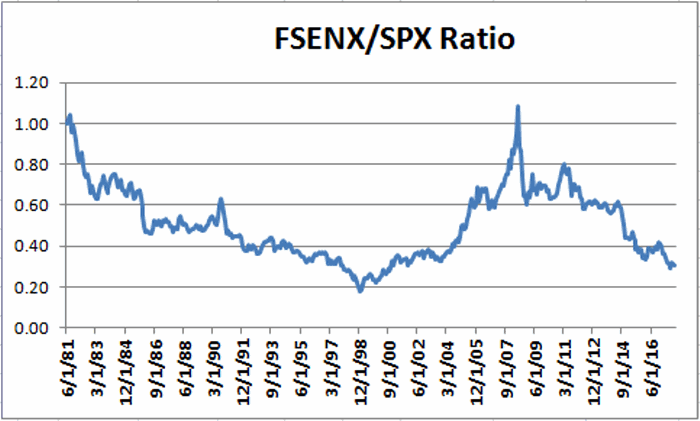
Figure 2 displays the FSENX/SPX ratio. This ratio is derived by dividing the red line in Figure 1 by the blue line Figure 1).
When the line is rising it means that FSENX is outperforming SPX and vice versa. As you can see, FSENX has spent a lot of time underperforming.
Figure 2 – FSENX/SPX Ratio; 6/30/1981-11/30/2017
In A Nutshell:
- FSENX consistently underperformed SPX for about 17.5 years between 1981 and 1998
- FSENX vastly outperformed SPX for about 8.5 years from 1999 into mid-2008.
- FSENX has vastly underperformed SPX ever since.
Two Key Points:
- The trend favoring SPX over FSENX is still very much in force
- Eventually that trend will end and the line in Figure 2 will turn up again
A Way To Follow This Trend
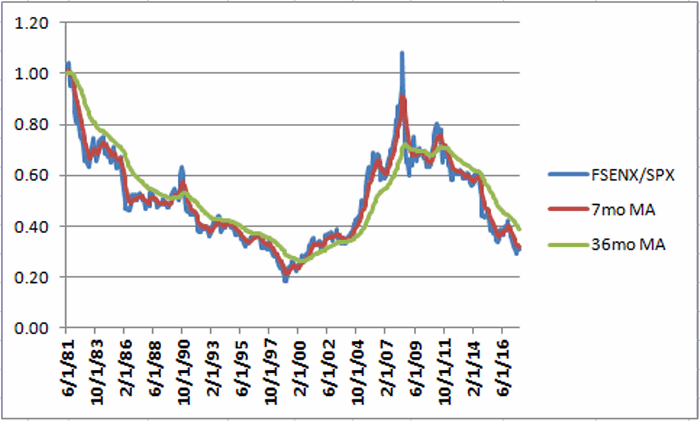
Figure 3 displays the same line as shown in Figure 2 (i.e., the FSENX/SPX Ratio) but also adds a 7-month and a 36-month exponential moving average.
Figure 3 – FSENX/SPX Ratio with 7-month and 36-month exponential moving averages
As with any moving average or set of moving averages, there will be whipsaws as well as lags in terms of identifying trends. But this does give us some way of objectively declaring the FSENX/SPX ratio as “up” (i.e., favoring FSENX) or “down” (i.e., favoring SPX). To wit:
- If the 7-month EMA is above the 36-month EMA then FSENX is favored
- If the 7-month WMA is below the 36-month EMA then SPX is favored
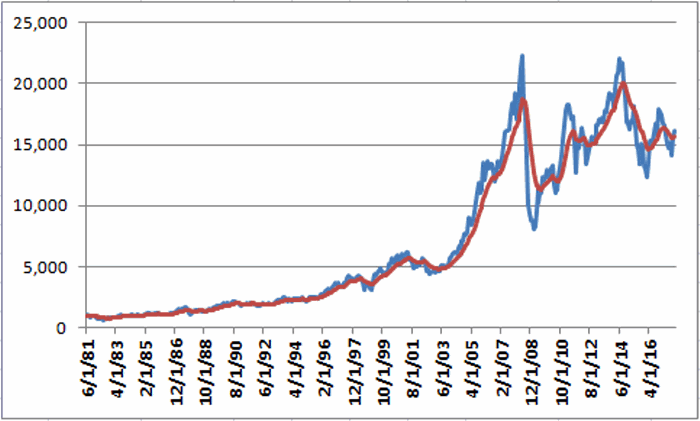
For the purpose of building a system we will also add a 12-month EMA to both SPX and FSENX as shown in Figures 4 and 5.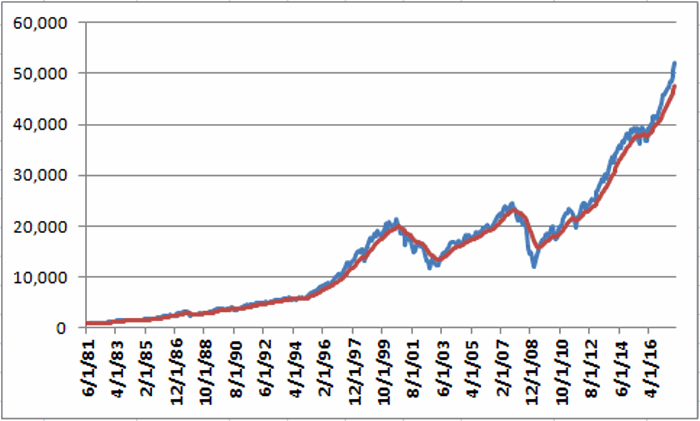
Figure 4 – Growth of $1,000 invested in SPX with 12-month exponential moving average
Figure 5 – Growth of $1,000 invested in FSENX with 12-month exponential moving average
- If SPX is above its 12-month EMA it is considered to be in an “uptrend”, if it is below its 12-month EMA it is considered to be in a “downtrend”
- If FSENX is above its 12-month EMA it is considered to be in an “uptrend”, if it is below its 12-month EMA it is considered to be in a “downtrend”
We will also add the Bloomberg Barclays Intermediate-Term Treasury Index to the mix for those times when neither index qualifies using the rules detailed in a moment.
Building A System
Here are the rules:
If:
*FSENX/SPX 7-month EMA is above the 36-month EMA
AND
*FSENX is above its 12-month EMA THEN hold FSENX
If:
*FSENX/SPX 7-month EMA is below the 36-month EMA
AND
*SPX is above its 12-month EMA THEN hold SPX
Else: hold intermediate-term (3-7 years) treasuries
As a benchmark we will split money 50/50 between SPX and FSENX and rebalance at the end of each year.
The cumulative growth of $1,000 invested using the rules above appears in Figure 6. The blue line represents the growth of $1,000 using the rules above. The red line represents the growth of $,1000 generated by buying and holding both SPX and FSENX and rebalancing every year.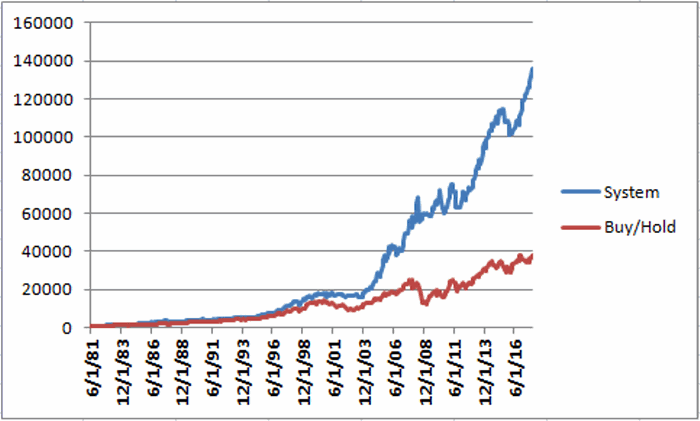
Figure 6 – Growth of $1,000 invested using “System” (blue) versus growth of $1,000 split between SPX and FSENX at rebalanced annually; 6/30/1981-11/30/2017
For The Record:
- $1,000 invested in the “system” grew to $135,884 between 6/30/1981 and 11/30/2017
- $1,000 invested in the “buy/hold and rebalance annually” method grew to $37,395 during the same time
Summary
Also for the record I am not recommending that anyone adopt the above as an actual investment method. The purpose of everything above is simply to highlight:
- That there is an interplay between energy (or any sector for that matter) and the broader stock market
- There may be ways to take advantage of that interplay
This article simply represents one place to start looking.
Disclaimer: The data presented herein were obtained from various third-party sources. While I believe the data to be reliable, no representation is made as to, and no responsibility, warranty or liability is accepted for the accuracy or completeness of such information. The information, opinions and ideas expressed herein are for informational and educational purposes only and do not constitute and should not be construed as investment advice, an advertisement or offering of investment advisory services, or an offer to sell or a solicitation to buy any security.

