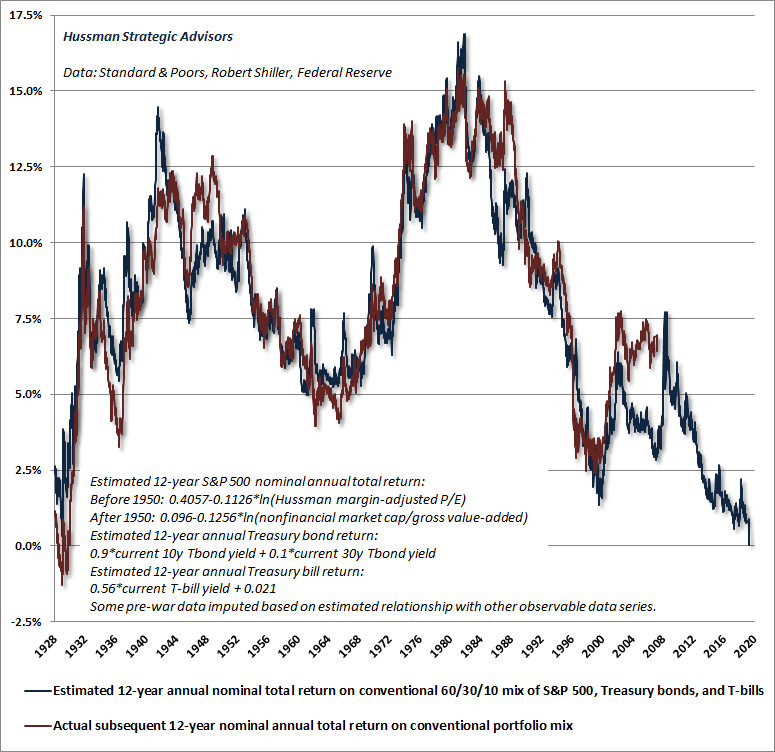
I just saw an update of John Hussman’s infamous model that shows a very clear correlation between stock valuations, defined as stock prices over U.S. economic gross value-added, and 12-year total investment returns.
This indicator is similar to stock market capitalization over GDP, which I have shown recently, except it is more predictive and specific for future performance.
The update explains that the indicator is higher than ever, including the 2000 tech bubble peak.
Hussman is seeing around a 67% crash following this bubble – and given the strong debt levels and downward demographic trends, I see worse.
But the real truth, by this model with a great past correlation, is simple: expect an average annual return of 0% per year after dividends and interest (total return) over the next 12 years. Look at this indicator that I have been following for decades.

First, look at the correlation on this chart from one simple indicator – that’s my type of research! The blue line is the indicator, and it leads the red line, the actual 12-year average returns, by 12 years.
Over the last century, the only time worse than today was 1929, when the 12-year predicted total return was -1.3%. That was only slightly worse than the current readings and was followed by an 89% stock crash.
It was 1.4% in early 2000 and 2.9% in late 2007, both more favorable than today – and look what followed both of those extreme valuations!
Hussman uses the S&P 500 price over U.S. gross value added in the economy. He is predicting returns on a standard 60% stock/30% bond/10% cash portfolio. Hence, stocks alone would only fare worse here.
To quote Hussman directly: “The more glorious the bubble in hindsight, the more dismal the investment returns become in foresight.” I simply call it: “The greater the bubble, the greater the burst.”
Hussman also states: “Investment is not independent of price. Whatever they (investors) are doing, it’s not an investment.” That means, to me, Dr. Lacy Hunt and money velocity indicators, that it is not about productive investment, but rather speculation, which never ends well.
Does this mean stocks top now? No, and my shorter-term indicators suggest another 10% plus coming in a matter of months before such a peak. That means this indicator is likely to end up even worse than the 1929 reading before this is over.
But again, what I love most about this model is that it is simple and allows investors to see implications well into the future.
This is why Hussman is one of my trusted “go-to” analysts. He goes after the truth, not the hype. He focuses on the big picture, not the complexity of the economy and investing.
