Technical Outlook:
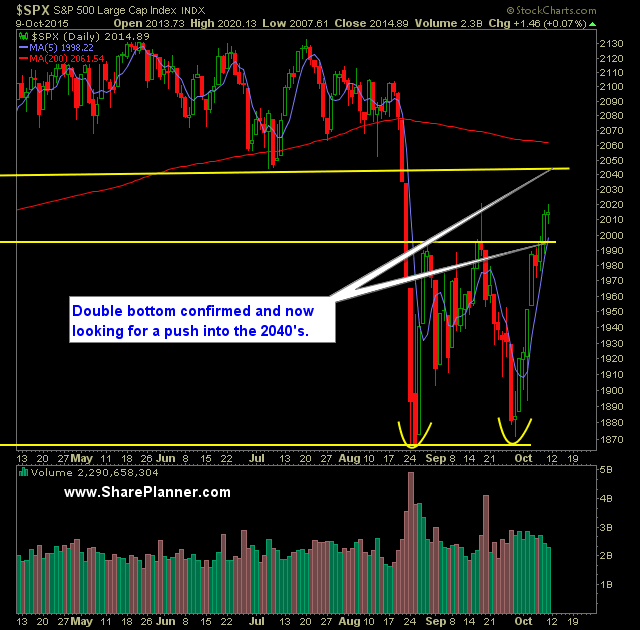
- SPX continues to rally strong here with a confirmed double bottom at 1997.
- The 5-day moving average is showing a lot of support as it rides the underside of daily price action.
- The next challenge for traders will be to see whether support in the 2040's can be broken or whether it re-ignites selling to the downside.
- 2059 is the break-even level for the market on the year. It also happens to be where the 200-day moving average is sitting at.
- N:SPY volume was weak on Friday and much lower than the levels we saw on Thursday. The price action was also confined to a very tight range as well.
- SPX has traded higher 8 out of the last 9 trading sessions. A bit of selling pressure in the form of profit taking shouldn't come as a surprise at some point. For now, ride the trend higher as long as it is willing.
- VIX dropped 2% down to 17. I wouldn't be surprised if this market managed to rally up until the VIX reached the 11-12 range that has been the starting point for all market reversals this year.
- SPX 30 minute chart remains strong with a nice series of higher-highs and higher-lows.
- T2108 (% of stocks trading above their 40-day moving average) is currently trading at 65% - one of the biggest rallies I have ever seen in the indicator - considering that it was trading at 12% just 9 days ago.
- The Fed has never raised interest rates at a point where the market was trading lower on the year.
- The large gaps in the market, the record number of stock buybacks, and ETFs that are constantly accumulating/dumping large chunks of stocks, and most importantly the high frequency trading, shows just how illiquid this market has become in recent years. These entities are the most responsible for the massive market swings that stocks incur each day.
My Trades:
- Did not close out any positions yesterday.
- Added one new long position to the portfolio yesterday.
- 30% Long / 70% Cash
- Remain long: N:EL at $80.52, O:SBUX at $58.67
- My focus in trading remains to trade to the long side.
Chart for SPX:

