- Stocks usually perform poorly when inflation is on the rise. Using the inflation rate, we developed a market timer according to two simple rules.
- Switching according to the Timer signals between the S&P 500 with dividends and a money-market fund would have provided from Aug-1953 to end of Jan-2016 and annualized return of 12.48%.
- Over the same period, buy-and-hold of the S&P 500 with dividends showed an annualized return of 10.08%, producing about a quarter of the total return of the Timer model.
- Sell Rule for stocks:
- INF > 6-mo SMA(INF) + 0.75%
- Sell when the inflation rate exceeds its 6-month moving average plus 0.75%.
- Buy Rule for stocks:
- INF
- Buy when the inflation rate becomes less than its 6-month moving average minus 0.20%.
The inflation rate (INF) is the 12-month rate of change of the consumer price index (CPI). The CPI is provided by the Department of Labor Statistics usually during the third week after the month to which it refers.
Rules
Performance
We calculated a hypothetical fund SPY* based on the performance of the S&P 500 with dividends reinvested by splicing the data from the SPDR S&P 500 ETF (NYSE:SPY) from 1993 to 2016, the Vanguard 500 Index Fund (VFINX) from 1980 to 1993, and before that from 1953 to 1980 daily data of the S&P 500 with monthly dividends taken from the Shiller CAPE data.
We simulated a hypothetical money market fund SHV* with the Federal Funds Rate from 1953 to 2007 and thereafter spliced the iShares Short Treasury Bond ETF (SHV) to it.
All trading is assumed to occur on the first trading day of the week after the 20th day of the month when CPI is known for the preceding month. A back-test of this model starting in 1953 provided the first buy signal for stocks on Aug-24-1953.
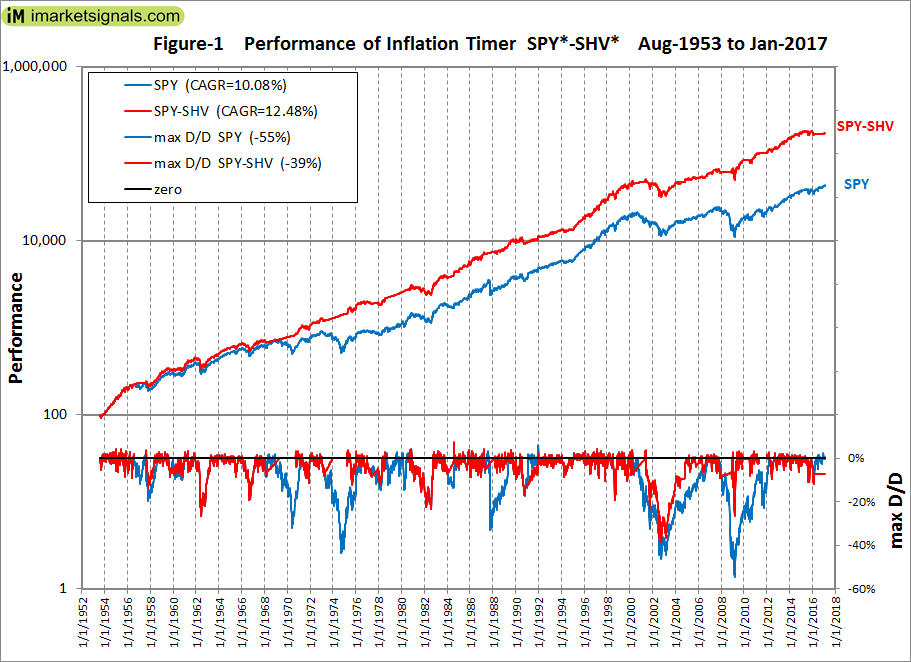
Over the period Aug-24-1953 to Jan-30-2017 the model, switching between SPY* and SHV*, showed an annualized return of 12.48% with a maximum drawdown of -39% in 2002. Buy-and-hold SPY* gave an annualized return of 10.08% with a maximum drawdown of -55% in 2009 (Figure-1).
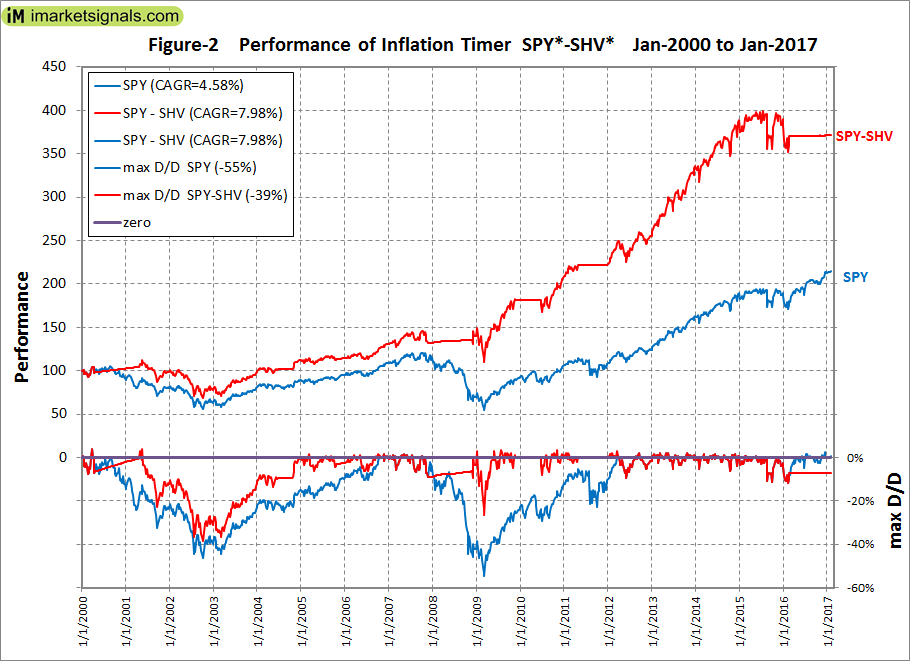
Over the period 1/3/2000 to Jan-30-2017 the model showed an annualized return of 7.98% with a maximum drawdown of -39% in 2002. Buy-and-hold SPY* gave an annualized return of 4.58% with a maximum drawdown of -55% in 2009 (Figure-2).
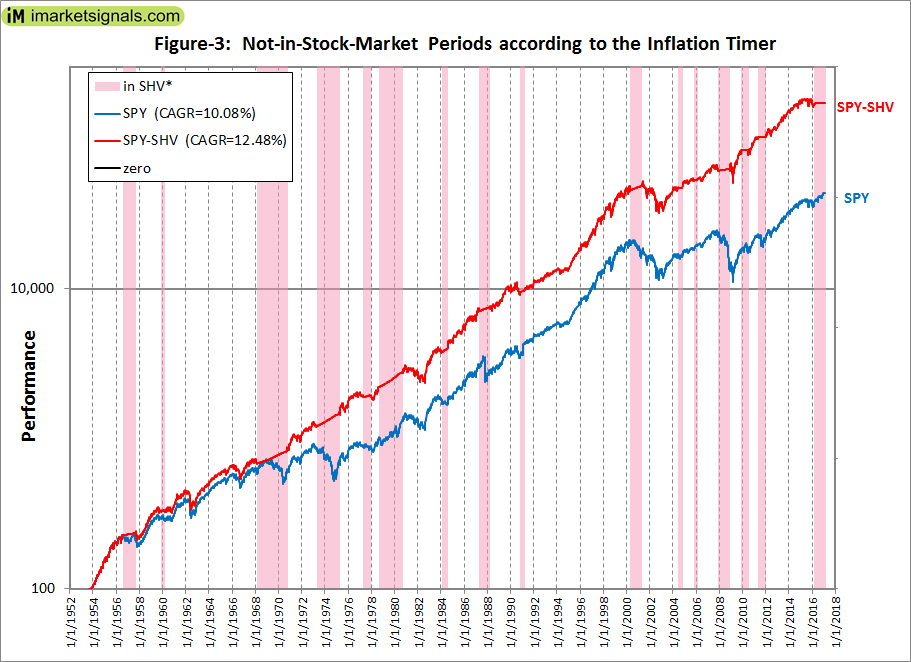
There were 16 periods from 1953 to 2016 when the inflation rate signaled to be in or out of the stock market. They are listed in the Appendix and are also shown by the vertical bars in Figure-3. Note that the Inflation Timer signaled to be out of the stock market during the 1987 market collapse, but it also provided a sell signal for SPY* on 2/22/2016, preventing the model from gaining another 19% to 1/30/2017.


Conclusion
Higher returns could have been achieved by using a longer term bond fund instead of a money-market fund. However, we wanted to show the most conservative performance from this model, which over the period 1953 to 2017 provided 3.95 times the total return of what a constant investment in the stock market would have produced.
