Hardware and information technologies solutions provider Dell Technologies (NYSE:DELL) stock has been a pandemic winner but is proving itself to follow through as a re-opening play as well. The Company continues to evolve with its APEX as-a-service (AaaS) accelerating the legacy hardware provider into hybrid on-prem hardware as needed and cloud-computing solutions provider or an operational expense (opex) model. The opex model provides enterprise customers storage and hardware upgrades, installation, management, and maintenance end-to-end services under a hybrid subscription/consumption-driven model anchored around its APEX consoles. The recently announced divesting of its remaining 81% stake in VMware (NYSE:VMW) also unlocks value for investors. Prudent investors looking for an enterprise recovery play can monitor shares of Dell Technologies to scaling into exposure.
Q4 FY fiscal 2021 Earnings Release
On Feb. 25, 2021, Dell released its fourth-quarter fiscal 2021 results for the quarter ending January 2020. The Company reported earnings-per-share (EPS) of $2.70 excluding non-recurring items versus consensus analyst estimates for a profit of $2.14, a $0.56 per share beat. Revenues climbed 8.7% year-over-year (YoY) to $26.11 billion, beating consensus analyst estimates for $24.5 billion. Full-year revenues high record levels at $94.4 billion, up 2% YoY and EPS of $8.00 was up 9% YoY. The Client Services Group (CSG) revenues hit $48.4 billion, up 5% YoY. The Company shipped out 50.3 million units, up 8% YoY. Commercial PC unit growth was 11% with market share growth in notebooks. Consumer business hit a record $13 billion in revenues, up 12% YoY. The Company expects to pay down at least $5 billion in debt this year. The Company also expects strong mid-teens revenue growth for the year.
Conference Call Takeaways
Dell COO Jeff Clarke provided examples of its highly distributed vision:
“Customers like University of Pisa in Italy, turned to PowerStore, PowerScale and PowerMax for core storage infrastructure to enable remote learning and accelerate their hybrid cloud and AI projects. Swisscomm AG is using out as-a-service and flexible consumption store solutions for affordable on-demand access to extra capacity when they need it. And, Dell Technologies is in the middle of the edge and telecom transformation, most recently with Tech Mahindra and AlefEdge Brazil to offer edge computing as-a-service to local telecommunication service providers.”
He noted:
“Resilient demand was driven by the fast-growing technology-enabled world where consumers can do anything from anywhere. Instead of going to work, school, entertainment, a restaurant, or shopping it all comes to us, the PC is the hub of this new economic model.”
He concluded:
“The do-it-from-anywhere world is here to stay. We believe the total addressable market is expanding as there are still millions of children around the world that need PCs, the number of PCs in a household continues to increase, and additionally, refresh cycles are accelerating with the shift in notebooks.”
The Company expects 5G connectivity, “will drive $700 billion in cumulative spend on edge IT infrastructure and data centers within the decade.”
VMware Spin-Off
On Apr.14, 2021, Dell Technologies announce it will spin off its 81% stake in VMware resulting in two standalone companies. Dell will distribute a special cash dividend of $11.5 to $12 billion to VMware shareholders, Dell will receive $9.3 to $9.7 billion to pay down debt, which stands at $48.5 core balance, which should position the Company for investment grade ratings. The transaction is expected to be completed by Q4 fiscal 2021.

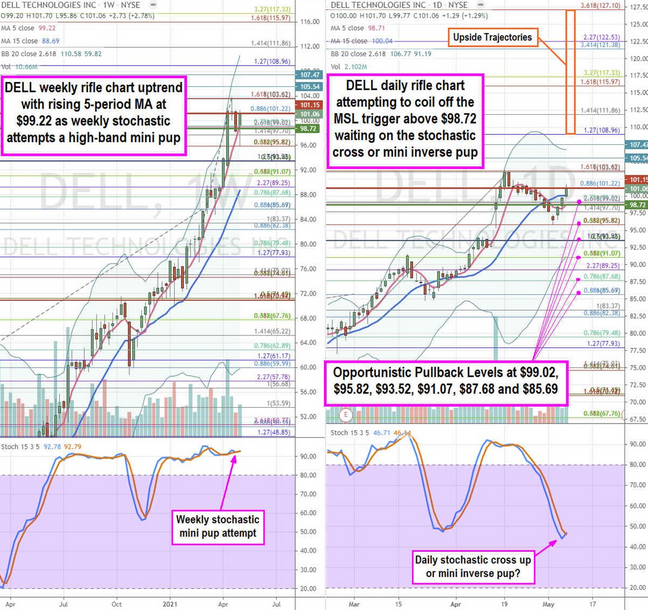
DELL Opportunistic Pullback Price Levels
Using the rifle charts on the weekly and daily time frames provides a precision view of the landscape for DELL stock. The weekly rifle chart has been in a powerful uptrending with a rising 5-period moving average (MA) support at $99.22 pointing at upper Bollinger Bands (BBs) at $110.58. The weekly stochastic is poised to form a high band mini pup or a peak and cross down. The current trend peaked at the $103.62 Fibonacci (fib) level. The daily rifle chart for a market structure low (MSL) on the breakout through $98.72 after recovered from the daily market structure high (MSH) sell trigger on the $101.15 breakdown. The daily rifle chart is a make or break as the 5-period MA attempts to slope back up at $98.71 and the daily stochastic attempts to cross back up through the 50-band. However, the daily stochastic could form a bearish mini inverse pup if shares fall back below the daily 5-period MA. This can provide prudent investors with opportunistic pullback levels at the $99.02, $95.82 fib, $93.52 fib, $91.07 fib, $87.68 fib, and the $85.69 fib. Upside trajectories range from the $108.95 fib up to the $127.10 fib.
