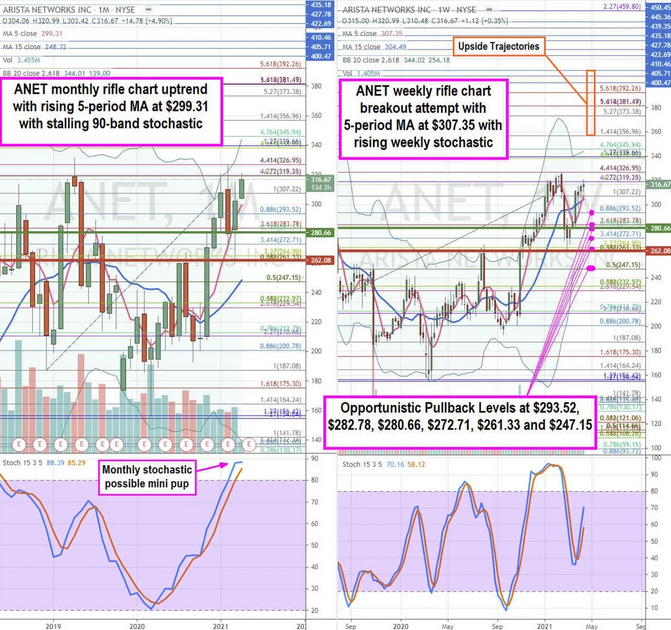
Cloud networking solutions provider Arista Networks (NYSE:ANET) stock has been recovering towards its all-time high levels hit two-years ago. The provider of cloud networking hardware and services has recovered from the pandemic and returned to double-digit growth mode. This is fueled by 5G rollout, digital transformation, and web infrastructure buildout tailwinds that should sustain momentum in 2021 with the acceleration of COVID vaccinations. The enterprise segment should also rebound with the return to work and re-opening narrative applying across the board resulting in higher capex spending. While shares are not cheap, prudent investors can apply patience to consider scaling in at opportunistic pullback levels.
Q4 Fiscal 2020 Earnings Release
On Feb. 18, 2021, Arista reported its fiscal Q4 2020 results for the quarter ending December 2020. The Company reported earnings-per-share (EPS) of $2.49 versus consensus analyst estimates for $2.30, a $0.10 beat. Revenues rose 17.4% year-over-year (YoY) to $648.48 million, beating analyst estimates for $630.32 million. Non-GAAP gross margins reached 65%. Full-year 2020 revenues hit $2.32 billion, down (-3.9%) YoY due to the effects of COVID-19. The Company rolled out its 750 Series modular chassis under its Cognitive Campus portfolio.
The Company announced DANZ Monitoring Fabric on Arista switching platforms enabling enterprise-wide traffic visibility and contextual insights. The Company announced the Attack Surface Assessment service which is an advanced security service product through its Awake Security subsidiary. Arista Networks raised Q1 2021 revenue guidance between $630 million to $650 million versus $608.12 million consensus analyst estimates. The Company expects non-GAAP gross margins between 63% to 65%.
Conference Call Takeaways
Arista Networks CEO Jayshree Ullal, set the tone:
“In Q4 2020, Cloud Titan was our largest vertical. Enterprise was second, followed by financials in third place, and the providers, both service provider and cloud specialty providers tied for fourth place. In terms of sector trends, we see Cloud Titans at approximately 36%, Enterprises, including Financials at approximately 36%, and providers at approximately 28% consistent with the effective ranges we have provided. Microsoft (NASDAQ:MSFT) was the only greater than 10% customer concentration at 21.5% for the year 2020. In terms of geographical mix, the international contribution was slightly higher at 26%, with the Americas at 74% for Q4 2020.”
CEO Ullal anticipates Cloud Titans to continue to grow towards the 60% to 65% in the future with more diversified products and customers. Subscription-based services are expected to contribute grow to 25% of revenues. He summed it up:
“As we experience the explosion of users, devices, IoT, OT, more video, more mobility of workloads and workflows, the boundary between all the locations, whether it’s your office, cloud, home, teleworker, and transit and user is really blurring into elastic workspaces. We believe Arista is well-positioned to address the data-driven networks for this client-to-cloud workspaces.”
Cloud Titans
The Company’s Cloud Titans customers include Microsoft, Facebook (NASDAQ:FB), and Amazon (NASDAQ:AMZN) AWS. All three companies are experiencing significant growth spikes and Arista should see material benefits as a result. The Company is winning market share from networking giant Cisco Systems (NASDAQ:CSCO). Since the Company is less than a tenth of Cisco, there’s a lot more room to grow. Prudent investors can monitor for opportunistic pullback levels to consider scaling in some exposure.

ANET Opportunistic Pullback Levels
Using the rifle charts on the monthly and weekly time frames provides a precision view of the landscape for ANET stock. The monthly rifle chart has an active uptrend with a rising 5-period moving average (MA) support at $299.31 with monthly upper Bollinger Bands (BBs) near the $345.94 Fibonacci (fib) level. The monthly stochastic is stalling near the 90-band to trigger a bullish mini pup or a crossover down. The monthly market structure high (MSH) sell triggers under $262.08. The weekly rifle chart is attempting to resume an uptrend as the weekly 5-period MA at $307.35 crosses up through the weekly 15-period MA at $304.49. The weekly market structure low (MSL) buy triggered on the breakout above $280.66 as the weekly stochastic crossed back up again. The weekly upper BBs sit near the $345.94 fib. Prudent investors can monitor for opportunistic pullback levels at the $293.52 fib, $282.78 fib, $280.66 fib, $272.71 fib, $261.33 fib, and the $247.15 fib. Upside trajectories range from the $356.96 fib up to the $410.46 level. Keep an eye on CSCO as a networker peer.
