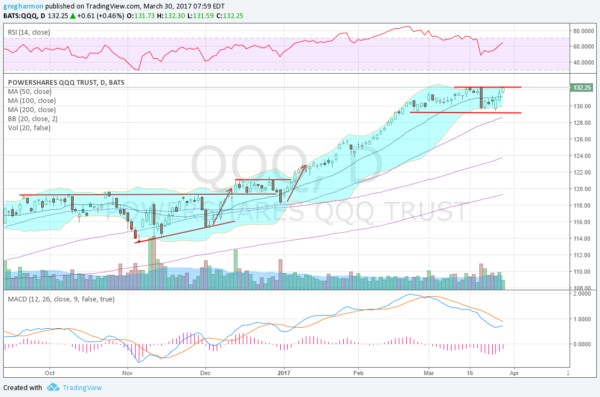
Following the election in November the Nasdaq 100 started higher with the rest of the markets. But it quickly stalled when it reached the prior high from October and resistance. It would take another pullback and then a drive higher at the beginning of December to finally make a new high. Even that stalled though as other areas plugged higher. It was not until the end of the year, 7 weeks later, that the Nasdaq really started to heat up.
The move that began January 3rd ran off a quick 10% to the upside over the next 2 months. In late February it slowed the rise into a drift that continued into mid March. With the benefit of hindsight we can now see that this was a consolidation range that has now been running for 2 months. Over the last 3 weeks the Bollinger Bands® have squeezed in, often a precursor to a move. And the price has made 3 strong days to the upside, bringing it back to the top of the range, and printing an all-time high close Wednesday. What is next?

One interpretation would be an advance higher. The week this far has printed a 3 advancing white soldiers candlestick pattern. After this consolidation it is is a sign of strength and foretells more upside to come. In fact, this pattern started the 10% move higher from January 3rd as well. A measured move would then give an eventual target to 142 on the Nasdaq ETF (NASDAQ:QQQ). Momentum indicators have reset lower after the strong run and are turning higher again in the bullish zone. These support a push higher. A new all-time high close Thursday would add to the confirmation of a range break higher.
The information in this blog post represents my own opinions and does not contain a recommendation for any particular security or investment. I or my affiliates may hold positions or other interests in securities mentioned in the Blog, please see my Disclaimer page for my full disclaimer.
