Investing.com’s stocks of the week
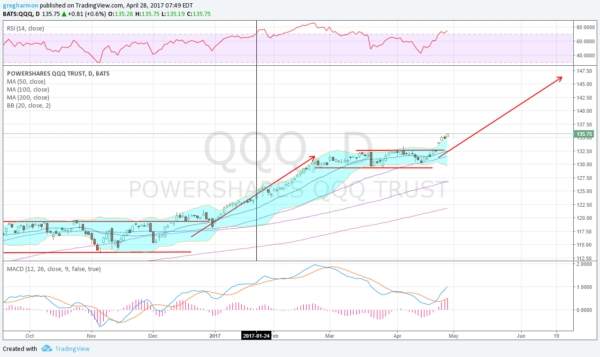
Sentiment changed at the end of last week and that sets up for a renewed run in equities. But just how strong will this move be? When you look at the Nasdaq 100 it could just be getting started. The chart of the Nasdaq 100 ETF (NASDAQ:QQQ) below tells the story.
The Nasdaq 100 broke out of a two-month consolidation at the beginning of the week when it gapped higher. And through the close Thursday it has just marched higher. Barring a 3% drop Friday it will print an new all-time monthly closing high for April. But just how high can it go? The break of the channel gives a Measured Move to 146.50, a full 10 points above where it is trading in the pre-market hours Friday. This comes from measuring the move into that 2 month consolidation and adding to the exit. Symmetry would look for that to happen toward the end of June.

But hold on, momentum is overbought, right? The chart does show the RSI in technically overbought territory. But there is a saying in technical analysis, overbought can always get more overbought. In fact you only have to look back to January and the black line in the chart to see an example of that. This is when momentum first entered overbought territory on the last leg higher. The QQQ was at 123.50 then and continued to move higher to 1332.50 before it stopped. Overbought got more overbought.
The other momentum reading, MACD, seems to just be getting started. It crossed up, a buy signal, on Monday and is no where near the highs seen in late February. It may not be a straight run higher, but the QQQ could still have a lot of gas left in the tank.
