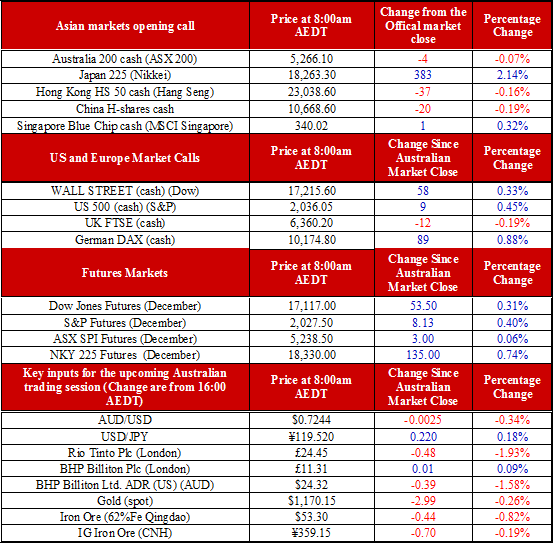
China growth met with skepticism
Earnings from the US continue to follow the trend of disappointing top line numbers saved by cost cutting, which is seeing the EPS line just beating estimates.
On the current course, the US will see its worst quarterly reporting season in four years; however, 70% of companies on the S&P that have already reported are beating estimates on the EPS line.
What’s catching my attention
China’s GDP – strangely, ANZ managed to forecast China’s GDP was going to be 50 basis points worse than the reported actuals, but the 6.9% has been met with a high level of skepticism. There’s no escaping the fact it’s the lowest read since the first quarter in 2009.
The formula for GDP = consumption + investment (private) + government + (exports – imports). The G in that equation registered near enough to a 27% increase year-on-year and is clearly propping up growth. This also illustrates stimulus is happening. Here is the figure we are concentrating on, nominal GDP was 6.2% once you apply the 0.7% deflator – a sign that China is slowing fast.
Second part of the China data that may have been missed in all the hype around the GDP read – industrial production (IP) fell to 5.7% from 6.1%, with estimates being 6.0%. In March, IP registered its lowest read in 25 years at 5.6%. Yesterday’s IP supports President Xi Jinping comments from the weekend that the ‘sluggish world economy is weighing on China’s growth’.
The commodities complex was not impressed with the China data – all major industrial metals on the LME fell between 0.7% to 2.8%. Aluminium, an OPEX metal, was the worst performer.
Morgan Stanley (N:MS) currently holds the wooden spoon for the worse report of the season. MS reported an EPS line that was 20 cents below consensus with top line numbers that were just as horrible. Like Goldman Sachs (N:GS), MS’ bond trading was down; however, the major reason for these figures is its private investments into China which saw mass write-downs.
RBA minutes today. The interbank market continues to flip-flop around the 3 November meeting, spiking to 39% yesterday, and sliding back to 33% after the China GDP figures. December slid back to be a sub 50% chance.
On the other hand, now over 60% of economists see a 25 basis point cut on Melbourne Cup day. The number of economists that see two cuts by May 2016 has risen past 50% for the first time.
The AUD’s reaction to RBA divergence views and the China GDP figures is reflected in the last 24 hours of trading, coming a full circle in price. It spiked on China figures and then grinded higher still as the interbank market followed suit. When economists and analysts reports hit the Street, the AUD came crashing back down to the level it started at. The Melbourne Cup is a live event and the market is currently placing an each-way bet.
Bit of a directionless open this morning. We are calling the ASX down four points to 5266. Iron ore was down slightly and oil lost further ground, yet US futures have shifted higher. We would currently expect a relatively quiet session.

