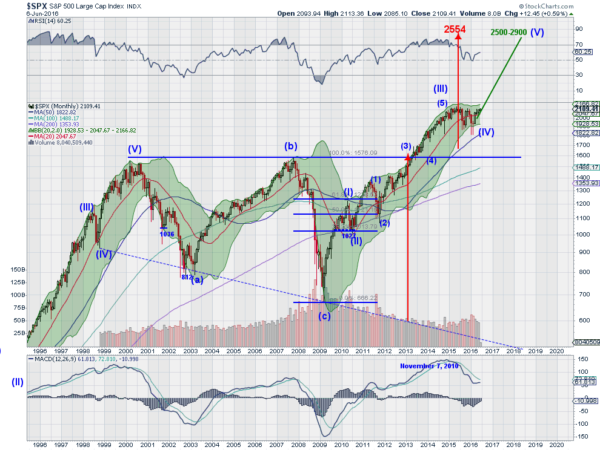
Four months ago the Groundhog came out of his hole and did or did not see his shadow. I forget. This of course meant that we were in for 6 more weeks of winter…. or that winter was over. Every year we go through this and by the time the weather up here by the Great Lakes is no longer in doubt we have all forgotten everything about Groundhog day.
So was this year different? I do not know. Financial pundits make a living professing that this time will be different. And then other pundits make their living explaining why it is never different. Data gets manipulated to explain and justify whichever side you of an argument you are on. So with all that, who is going to read further when I write, this time is different?

Maybe different is not quite the right way to explain it. The chart above has been a rough guideline for me for almost 6 years. Of course I did not know where all the points would be in advance. It is a living growing beast. But the original “what if” that came out of a higher low in 2010 to a higher high has been driving it.
The break to new all-time highs in 2013 added another dimension. Now not only was there an Elliott Wave pattern looking much higher, but a classical triangle break pointing to the stratosphere. Along the way momentum also joined in supporting the upside. The RSI has been in the bullish zone since then. Even the pullback in the MACD recently has held in positive territory and looks to be turning back up. A reset for another run higher?
So what is different? In any live breathing thing it is impossible to predict what will happen next. And this has been the case for the fourth wave in the Elliott Wave pattern. Is it over? Does it not conform? I am sure someone will tell me I am wrong. Maybe 500 of you will. But the price action will tell a different story should the S&P 500 make a new all-time high.
At that point I will look back and see that Wave (1) within Wave (V) has been underway since the February low. Of course this may never happen. I am open to that possibility. But a new all-time high, backed by supporting momentum, after a 12 or 18 month correction though time opens up the real possibility of the market going much higher. Chart patterns suggest 2500 or higher. That is what is different this time.
The information in this blog post represents my own opinions and does not contain a recommendation for any particular security or investment. I or my affiliates may hold positions or other interests in securities mentioned in the Blog, please see my Disclaimer page for my full disclaimer.
