When central banks create money to underwrite a worldwide credit boom, do people become prosperous? Or does the electronic money creation encourage excessive borrowing that steals from future well-being?
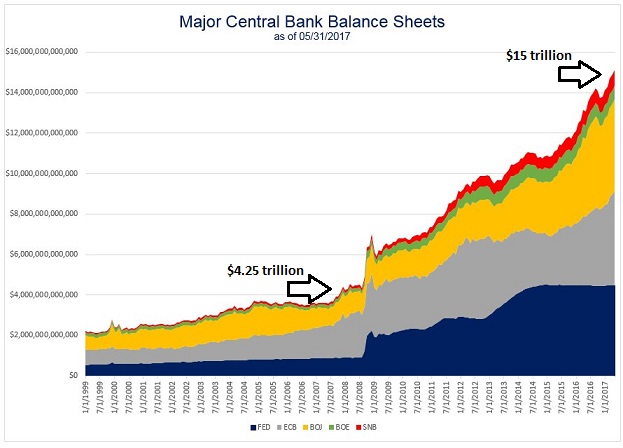
Consider the $10.75-plus trillion that central banks created in response to the U.S. financial crisis of 2008 and the subsequent economic stagnation across the globe. Monetary policy authorities primarily acquired “IOU” assets (e.g., sovereign debt, corporate bonds, etc.) to depress interest rates. The ultra-low rates stimulated unbridled borrowing from the financial system by households, businesses as well as governments.
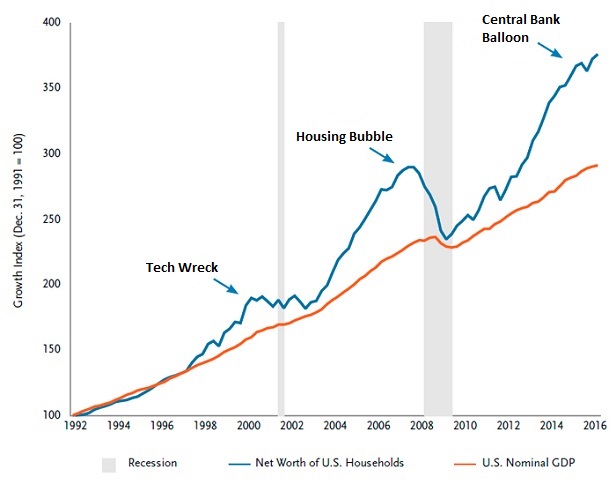
Some of the borrowed money at ultra-low rates went toward the maintenance of living standards; some of it went toward capital expenditures including the hiring of human resources. Yet a bulk of the explosion in credit made its way into total return assets like stocks, junk bonds and real estate. The ensuing price gains for total return assets formed the basis for a prodigious wealth effect.
Unfortunately, the perceived prosperity may prove to be ephemeral. Why? Because the growth of debt is proceeding at a much quicker pace than the growth of economies themselves.
According to the Institute of International Finance (IIF), debt held by households, governments, financials and non-financial corporations in developed markets jumped from $128 trillion to $160 trillion in the last decade alone. Putting that in context? Developed economies increased their leverage from 348% debt-to-GDP to 390%.
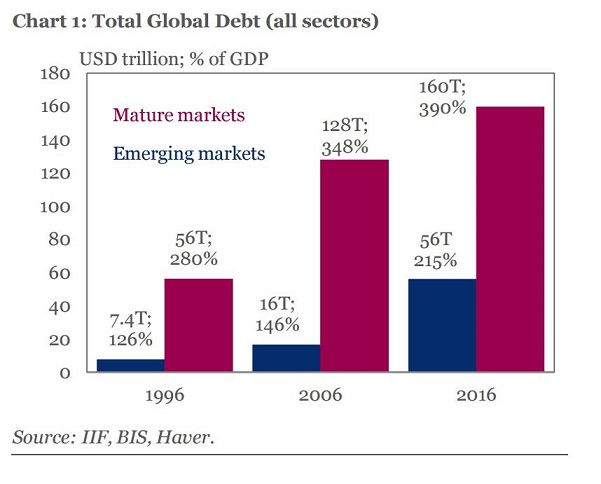
The picture may be even murkier for emerging markets. Due in large part to record-setting credit expansion in China, ’emergers’ have levered up from 146% debt-to-GDP in 2006 to 215% by the end of 2016. When you combine emerging economies with mature ones, credit inflation/debt expansion is proceeding at twice the pace of economic growth.
Can the current credit boom continue without incident? I seriously doubt it. For one thing, global interest rates cannot move lower indefinitely to offset ever-increasing debt loads. The leverage is increasing much faster than the income available for servicing obligations.
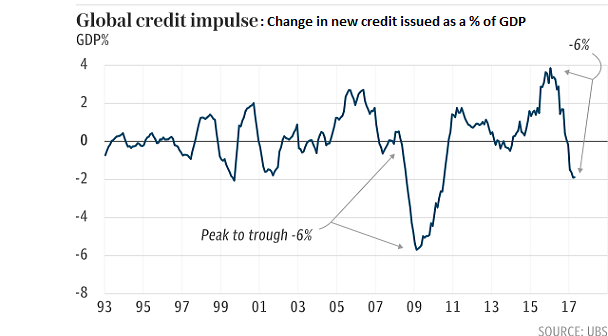
Secondly, adverse changes in ‘credit impulse’ may lead to the reversal of the wealth effect. What is credit impulse? The change in new credit issued as a percentage of gross domestic product (GDP). According to UBS, the change in new credit issued as a percentage of GDP has plummeted 6% from its peak in 2016.
Think about it. Central bank policy makers have readily acknowledged economic reliance on credit-fueled consumption and investment. So what happens when we really do reach a point of credit saturation?
Data suggest that it is already taking place in areas like commercial real estate (CRE). Brick-n-mortar retailers are shutting down thousands of shops. Meanwhile, scores of billion dollar property projects do not currently have enough tenants to fill the space. Both of these forces — retail closings and empty commercial buildings — are happening at a time when banks appear to be lending less.
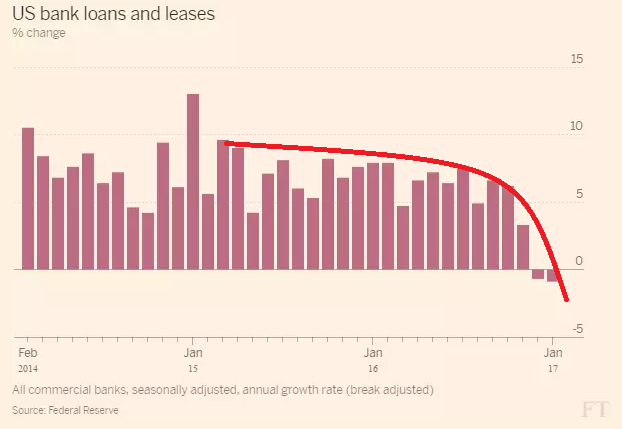
Might this put commercial real estate (CRE) under enormous pressure? What happens when the short-term CRE loans need to be rolled over into new loans? The artificially low cost of credit that pushed U.S. commercial property prices toward astronomical valuations is beginning to look like ‘malinvestment.’
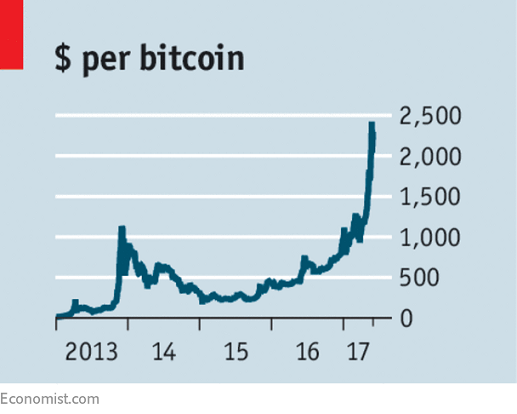
What about cryptocurrencies like bitcoin? Sensible investment or wild speculation?
Naysayers see no risk of credit saturation. Key borrowing costs remain low. And they see a world where easy access to low rate borrowing will remain in perpetuity. After all, how can there be malinvestment when FANG stocks – Facebook (NASDAQ:FB), Amazon (NASDAQ:AMZN), Netflix (NASDAQ:NFLX) and Google/Alphabet (GOOG) – are making people rich.
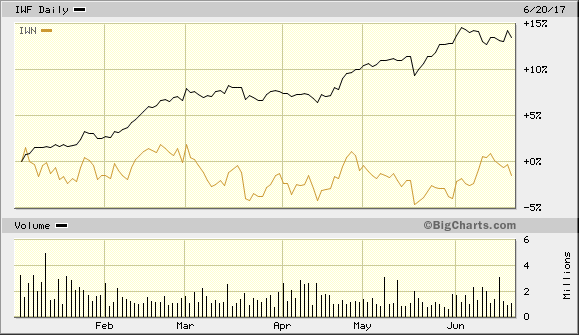
Speaking of FANG, Bank of America (NYSE:BAC) recently revealed that 71% of mutual fund managers are overweight the acronym’s components. And why not? Each is up anywhere from 25% to 33% in 2017 alone. Yet maybe… just maybe… we’re witnessing speculation as opposed to investing. Large-cap growth funds like iShares Russell 1000 Growth (IWF) do not typically outperform small-cap value funds like iShares Russell 2000 Value (IWN) by 1500 basis points (15%) in less than six months time.
It is certainly true that bullish market momentum can persist far longer than risk managers dream possible. I sounded an early alarm to reduce riskier asset exposure on December 18, 2014 when the Federal Reserve settled its last money creating, credit-fueling bond purchase (a.k.a. “QE3”). We downshifted moderate growth-and-income clients from their target allocation of 70% widely diversified stock to 50% high quality stock; we downshifted from a target allocation of 30% widely diversified income to 25% investment grade income, leaving us with 25% in cash equivalents.
The downshift worked well through two harrowing corrections.
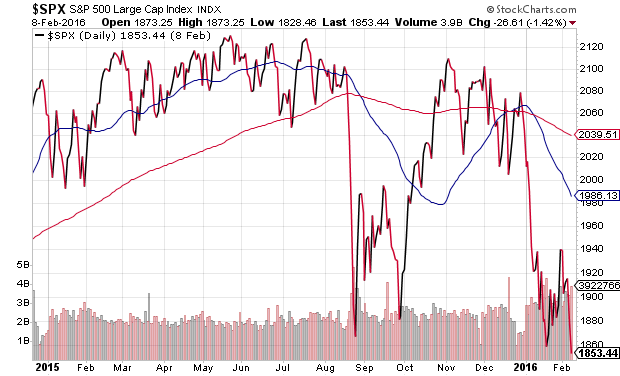
One might even say that it worked well across the 22-month period leading into the November election.
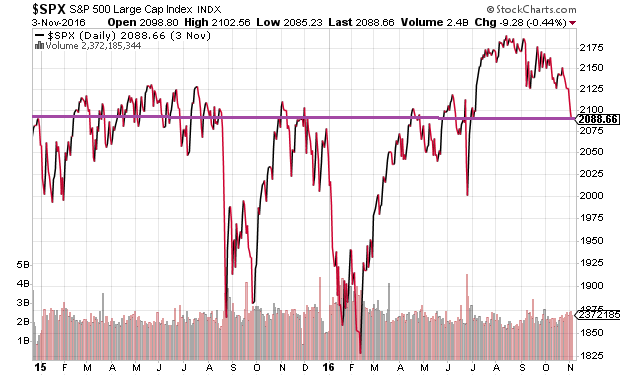
On the other hand, both the ECB and the BOJ announced significant electronic money creation/quantitative easing experiments in the first few months of 2016. What’s more, the Federal Reserve telegraphed that it favored raising overnight lending rates only once, as opposed to its original plan for four hikes. Outside of a few election fears, the S&P 500 has hardly looked back.
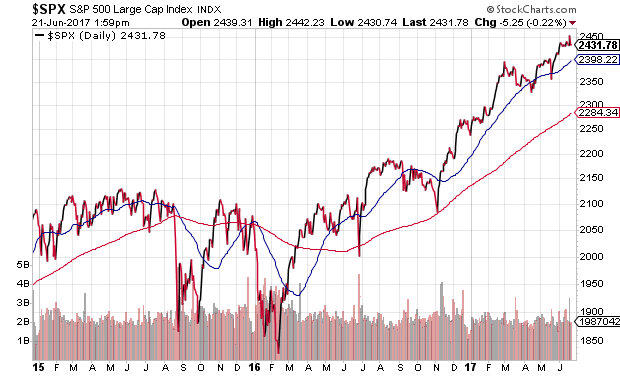
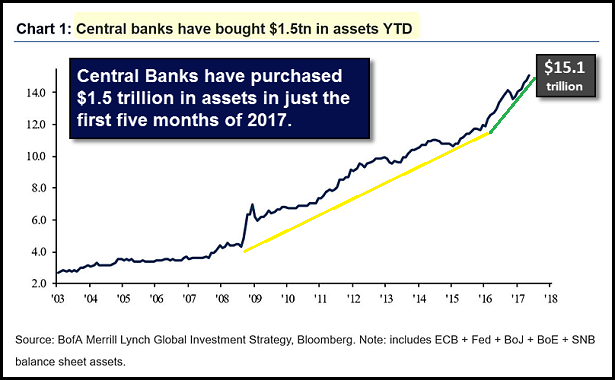
I underestimated the global impact of the European Central Bank (ECB), the Bank of England (BOE), the Swiss National Bank (SNB) and the Bank of Japan (BOJ). As seen in the chart below, central bank asset purchases actually accelerated in the first quarter of 2016 through May of 2017, providing the desired support for stock prices and stopping bearish price depreciation (2/2016) in its tracks.
A buying opportunity with cash may have been missed, yet a 50/25/25 allocation did not significantly underperform 70/30. The difference between the allocations has only been 4% since mid-December of 2014 when one employs index fund proxies like Vanguard Total Stock Market (NYSE:VTI), iShares iBoxx $ Investment Grade Corporate Bond (NYSE:LQD) and Guggenheim Enhanced Short Duration (NYSE:GSY). Risk-adjusted performance returns are quite similar.
Going forward, investors still need to weigh the upside potential for reward against the real risk of financial loss. Is it probable that we have already witnessed a stimulus peak? And if so, what does that mean for severely overvalued stocks?
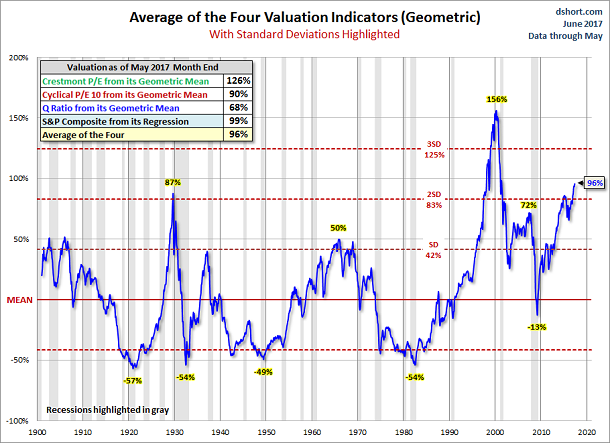
At the very least, there is a great deal of uncertainty surrounding the big time sources of electronic credit creation today (i.e., ECB, BOJ, BOE). According to Mohamed A. El-Erian, the Bank of England (BOE) wants to tighten and “…the European Central Bank (ECB) may be compelled to follow.” If the Fed does not backtrack on its current promises to hike rates as well as to unwind its balance sheet, the investment community may not remain sanguine about overvalued equities or economic stagnation.
One final thought: Friedrich Hayek published Monetary Policy and The Trade Cycle in 1932. In it, he wisely opined, combating a financial crisis with a manipulated credit expansion “…is to attempt to cure the evil by the very means which brought it about.” Leveraging ourselves to the hilt did not foster enduring prosperity; rather, we are delaying an inescapable reversal of fortune.
Disclosure: Gary Gordon, MS, CFP is the president of Pacific Park Financial, Inc., a Registered Investment Adviser with the SEC. Gary Gordon, Pacific Park Financial, Inc, and/or its clients June hold positions in the ETFs, mutual funds, and/or any investment asset mentioned above. The commentary does not constitute individualized investment advice. The opinions offered herein are not personalized recommendations to buy, sell or hold securities. At times, issuers of exchange-traded products compensate Pacific Park Financial, Inc. or its subsidiaries for advertising at the ETF Expert web site. ETF Expert content is created independently of any advertising relationships..
