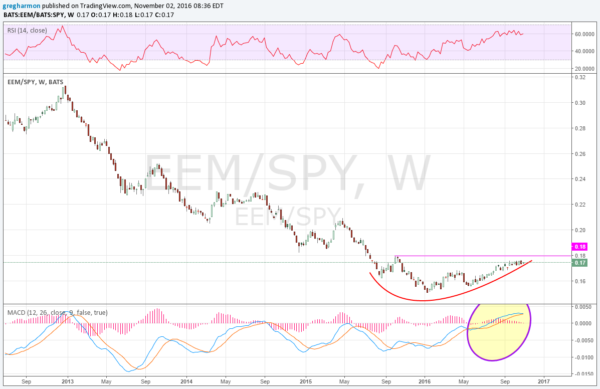
As I write the S&P 500 has gone through a 7 day slide, oil has fallen for over a week, and even treasury bonds are lower. But even with all this negativity there is one measure of risk taking in the market that is showing there is risk taking going on. It is the ratio of emerging markets (via iShares MSCI Emerging Markets (NYSE:EEM)) to the S&P 500. This ratio can be thought of as the trade off between buying stable country equity risk premium vs that of high risk countries. And what does it show?
The chart below shows it has been favoring the S&P 500 for quite some time. In fact, since peaking in late 2010 the buying has shifted towards US Equities and stayed strong in that direction for over 5 years. But the ratio made a bottom in January this year. Was it a shift beginning?

There are 3 signs to watch for to that would indicate confirmation of a shift into risky assets. The first would be a second higher high. The ratio moved up over the April high in September and that was a start. Now a move over the October 2015 high would show strength.
Next the momentum measure MACD, circled at the bottom, would need to hold over the zero line. It has moved up over zero once before in the downturn briefly at the end of 2012. Prior to the downturn the MACD was steady positive.
Finally, the RSI should move over 60. You can see it has been hugging this level since August. A solid move over 60 would show strong bullish momentum.
DISCLAIMER: The information in this blog post represents my own opinions and does not contain a recommendation for any particular security or investment. I or my affiliates may hold positions or other interests in securities mentioned in the Blog, please see my Disclaimer page for my full disclaimer.
