Topping Or Going Parabolic? I Say Topping Out
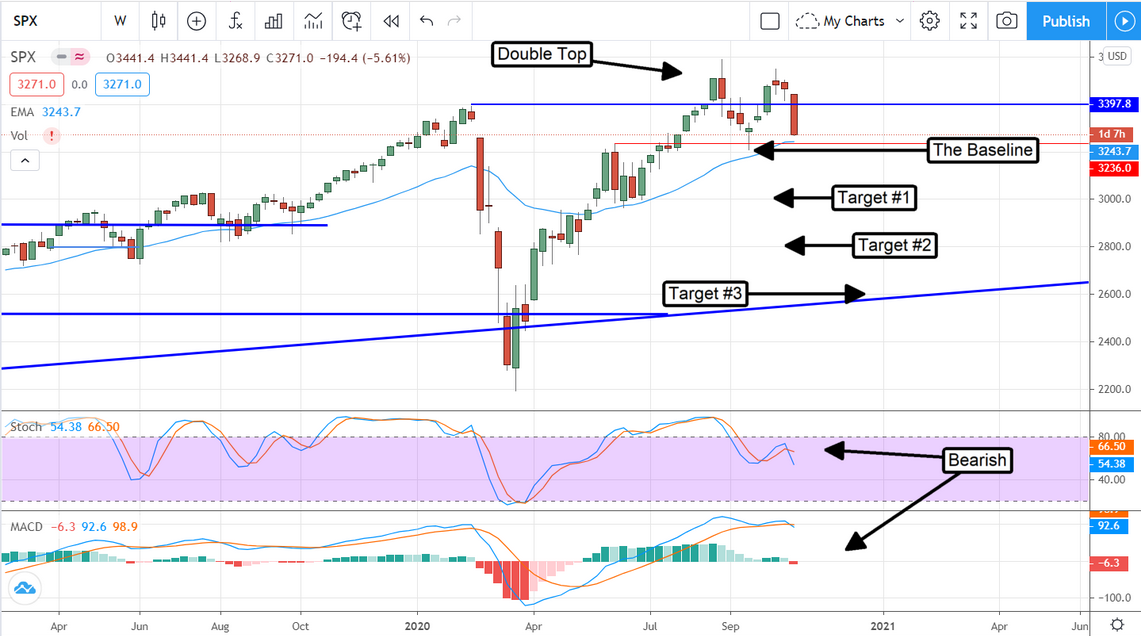
It was about two months ago that my colleague Jea Yu wrote an article about the S&P 500 (NYSE:SPY) speculating on its next big move. In his article he laid out a great case for whey the index would either top out or go parabolic and at the time I agreed with him wholeheartedly. The trends were up, the data strong, the outlook brightening so it seemed as if the index could keep going up forever. With one big caveat, what melts up must meltdown. Resistance at the previous all-time high, the all-time high set the very week the pandemic-correction began, a resistance level that could turn out to be quite strong was looming overhead. Fast-forward to today and it looks like we’re in for volatility at least and a correction to the 2,600 level in the worst-case scenario.

1) The COVID-Correction Isn’t Over - This whole correction-thing began when the pandemic struck. The pandemic caused a massive economic shutdown that cut deeply into corporate profits and that sparked a re-valuation of the market. Fundamentally there were multiple forces at work, the pandemic was just the spark that lit the house on fire, but that is a tale for another time. Moving forward to today, the spread of the sickness is accelerating to new highs globally and sparking another round of shut-downs. Many regions of the EU have enforced actual shut-downs, elsewhere the spread will cause a de-facto shut down because people will be 1) too sick to work and/or 2) afraid of getting sick.
2) Earnings Aren’t Enough Right Now - The economic and earnings rebound has been good, don’t get me wrong, but it may not be enough to keep the market happy in light of everything else. To say that the 3rd quarter earnings cycle is better than expected is a bit of a misnomer. Yes, the vast majority of the S&P 500 are beating their consensus targets but those targets have been too low for a long time. The results posted in the 2nd quarter were much better than expected, the outlook and data pointing to 3rd quarter results were the same. The market was expecting better-than-consensus earnings for those reasons and more. The analysts, by and large, were a bit aggressive with their initial downgrades and target-cuts and then far too shy with upgrades and updates going into this quarter. I myself have mentioned this many times in my articles over the past four or five months.
3) Overstimulated By Stimulus - It goes without saying that much of the summer rebound in economic and earnings results are due to the stimulus package. Most of that money got spent and spending floods the economy with cash and that’s good. Fast-forward to today and the market is trading just shy of a recently set all-time high that was driven by another round of stimulus that isn’t coming. Yes, we are likely to get stimulus in the future but think about this. If Trump wins it won’t be the ginormous $2.2 trillion the Democrats want, it will be a smaller more targeted package if it comes at all. If Biden wins we will get stimulus but not until he’s in office, way next year in late January at the earliest.
But, there’s a catch with Biden. If the economy continues to improve appetite for stimulus will decline so there’s no banking on a Biden win in that regard. Basically, the stimulus is a buy-the-rumor-sell-the-news event and the news isn’t good but there’s more. If Biden wins taxes go up and shave at least 8% off the S&P 500 earnings outlook INSTANTLY. That’s not good.
4) The VIX Is Frightening – The so-called fear index confirmed a bottom in September and then a reversal in October that points to increased volatility if not an outright decline in S&P 500 index prices. Looking at the chart, this index not only confirmed support, but it confirmed support and broke to a new high. And with supportive indications. The MACD and stochastic are both bullish for fear and point to higher prices. The next target here is the $50 level and that may not be the end. If fear breaks above $50 we may see it peak out near the spring highs around $80.

