Trump pushed several markets higher in November which is what most tend to call the ‘Trump Effect’. We observed that primarily a market sector rotation took place: the Trump Effect resulted in value outperforming growth.
For April 2017, we forecasted that the Trump Effect on markets would continue based on 5 charts. So far so good, but the key question is how readers can monitor for how long this effect will continue. At a certain point, the Trump Effect on markets will fade.
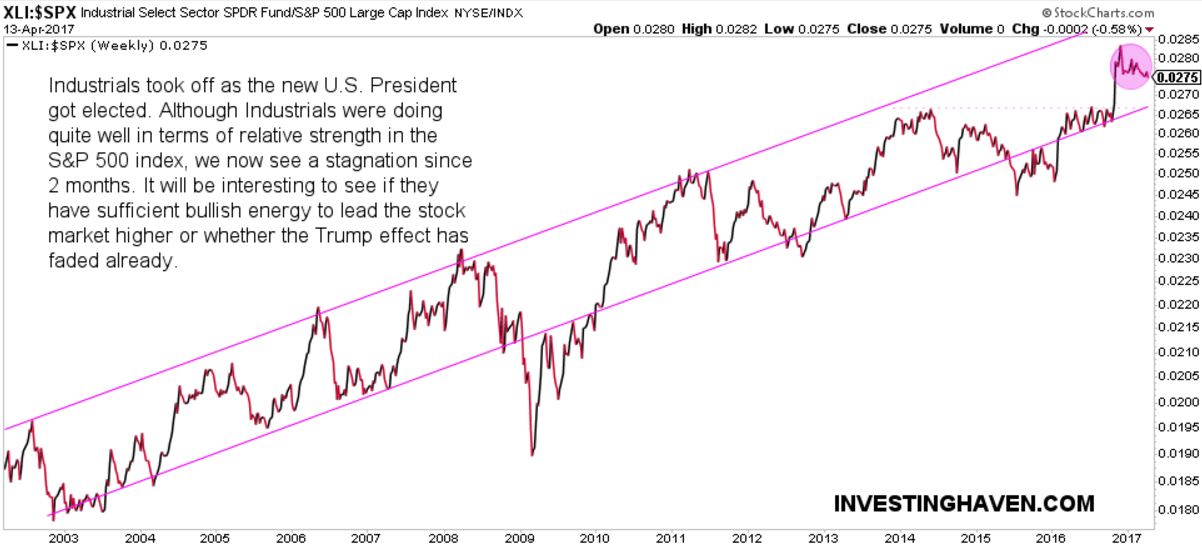
The answer to that question is this: follow the Industrials stock market sector in relation to the stock market index. In terms of stock market symbols: follow the Industrial Select Sector SPDR (NYSE:XLI) versus the S&P 500 chart.
Consider this to be a leading indicator for the Trump effect on markets.
We include the XLI/SPX chart below. Note this is a long term chart, covering 14 years, in order to spot meaningful trend changes. Any trend change on this timeframe will have meaningful implications for ALL markets, and the Trump Effect in particular!
Industrials took off at the end of last year. However, the purple circle which is annotated makes the point that this indicator is stagnating. That does not necessarily mean that the Trump effect is over, it merely means that it can go in both directions.
The really interesting level to watch is 0.0265, the lower level of the trend channel, for two reasons. On the one hand, it is a breakout level (see purple dotted line). On the other hand, it is the support level of the trend channel. Any attempt of this indicator to move below 0.0265 will suggest that the Trump effect is over.

