One of the things we contrarian income seekers love about closed-end funds (CEFs) is that they often sell for less than what they’re worth.
CEFs’ discounts are especially appealing these days, as the market levitates into the stratosphere. Because when you buy stocks through a CEF trading at, say, a 10% discount to net asset value (NAV, or the value of the investments in its portfolio), you can get into great companies like Apple (NASDAQ:AAPL), Microsoft (NASDAQ:MSFT)or Visa (NYSE:V) for 90 cents on the dollar.
This is a great trick—one you can’t find in ETFs or mutual funds. Plus, CEFs yield 7.3%, on average, today, so you get a monster payout in addition to your discount.
But you can’t just buy the deepest-discounted CEF and call it a day, because sometimes a CEF is “cheap for a reason.” This is often the case when a fund’s discount gets extreme—to the tune of 20% or more.
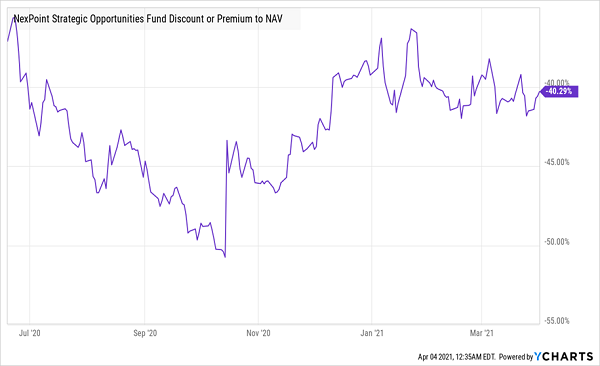
Which brings me to the fund I want to take a look at today: the NexPoint Credit Strategies (NYSE:NHF), owner of a whopping 40% discount. NHF is a diversified debt CEF that specializes in loans that real-estate developers take out to pay for their properties. The best way to think of the fund is as a kind of developer-focused investment bank.
As you can likely guess, the pandemic has had a big impact on NHF: with COVID-19 shutdowns and less utilization of real estate, NHF’s portfolio took a hit.
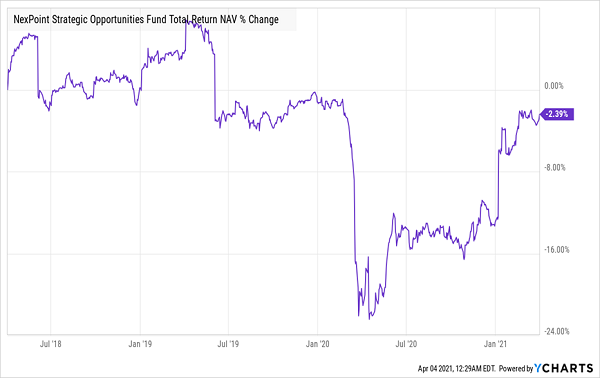
NHF’s Portfolio Dives, Then Bounces Back …

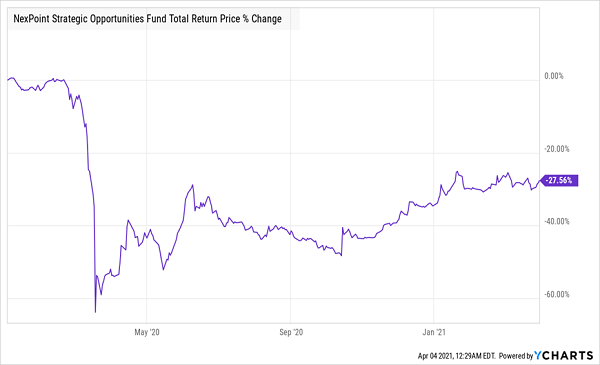
Funny thing is, as you can see above, NHF’s portfolio has almost fully recovered to pre-pandemic levels. But investors are still wary, which is why NHF’s total return based on its market price is still down double digits. This disconnect is why the fund carries that huge 40% discount to NAV.
… But CEF Investors Are Still Skittish

So what’s going on here? The truth is, investors’ wariness is well-founded—and it goes well beyond the struggles some commercial real estate landlords have faced due to COVID-19.
NHF Is a Black Box
Back in the middle of last year, NHF announced it would convert its legal status from a registered investment company to a real estate investment trust (REIT). It would remain a closed-end fund for the near term, but management hopes that switching over to a REIT will help NHF “reduce the fund’s historic discount to net asset value, as REITs have, on average, traded more favorably relative to NAV than closed-end funds.”
In reality, the announcement did little to help NHF’s discount shrink; in fact, it actually got bigger in the weeks after the announcement.
NHF Can’t Close the Discount Window

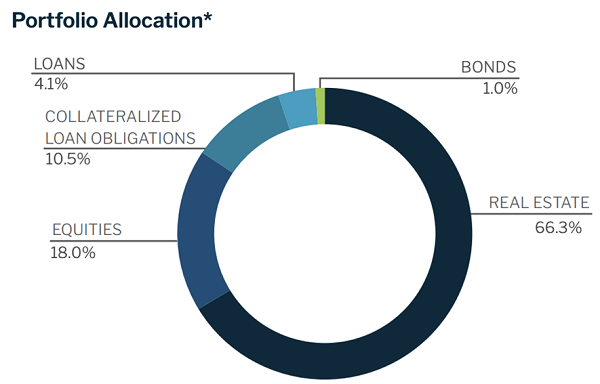
The reason for this is that NHF’s portfolio contains a lot of illiquid assets that are tough to value: only about 20% of its holdings are marked to market regularly. Most of the rest are so-called “level 3 assets,” with values that can be subjective and are assessed with great difficulty. These holdings, which include the real estate assets shown in the breakdown below, are also valued far less frequently than those that are traded on the stock market.

Source: NexPoint
The REIT announcement has made investors fret that these assets are currently overvalued, and the conversion might cause the fund’s NAV to drop, instead of fulfilling management’s hope that the change would cause NHF’s market price to rise.
Add in the fact that NHF’s 5.2% yield is far below the CEF average and you see why investors are refusing to buy the fund at anything but a fire-sale price.
NHF’s Future
This doesn’t mean NHF is a disaster; in fact, some tailwinds could help the fund perform well.
Chief among those is rising interest rates, which are a plus for some of NHF’s assets, specifically its collateralized loan obligations (CLOs), which rise with rates. What’s more, the fast pace of vaccination in the US, and NHF’s focus on American assets, could cause a surge in demand for the real estate in the fund’s portfolio portfolio and the real estate backing the loans it invests in, driving up its NAV and causing its discount to shrink fast.
Needless to say, such a bet is speculative at best, as the discount could remain for some time, given the uncertainty around the conversion.
But the wide range of NHF’s discount to NAV in just three years (from 3.6% in January 2018 to 64% in March 2020) does highlight a key strategy we always employ when investing in these funds: buying the heavily discounted ones when the market misprices them and selling them when their discount gets too small. The best part is that CEFs will give you high yields of 7% or more (sometimes much more) while you wait for the discount to go away.
Disclosure: Brett Owens and Michael Foster are contrarian income investors who look for undervalued stocks/funds across the U.S. markets. Click here to learn how to profit from their strategies in the latest report, "7 Great Dividend Growth Stocks for a Secure Retirement."
