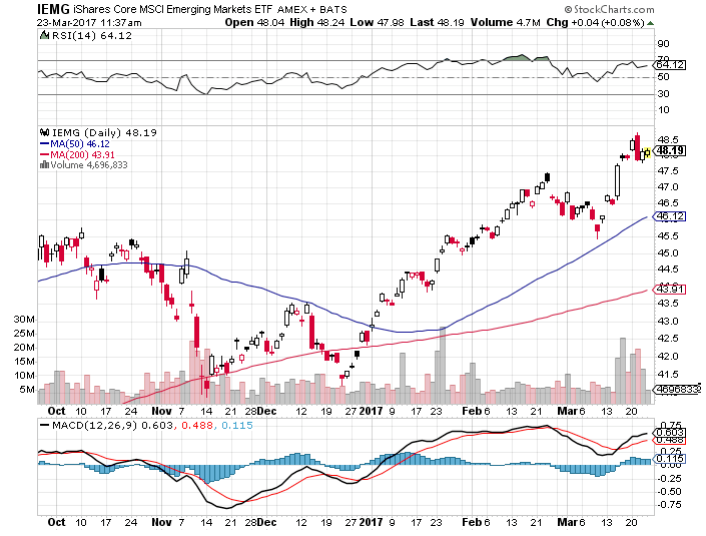
As the first quarter of trading draws to a close with global equities weakening off of all-time highs, Emerging Markets continue to pull their weight with relative outperformance vs. the S&P 500.
The two largest funds in the space in terms of asset size, the $50.7 billion VWO (Expense Ratio 0.14%) and the $29.8 billion EEM (Expense Ratio 0.67%) are impressively outracing the S&P 500 year-to-date, even with the recent hiccup in global equities.
VWO has packed in more than $1.5 billion year-to-date while EEM has seen inflows to a lesser degree ($385 million in), but the trend across the board in these two ETFs, as well as the third largest fund in the segment, the $26.5 billion IEMG (Expense Ratio 0.14%) has seen buyers, even on weakness.
IEMG itself has seen a massive $5.4 billion enter the fund just year-to-date, including more than $750 million just this week alone. That is quite a staggering amount inside of a three month period for the 3-star Morningstar rated fund that debuted in late October of 2012.
After these top three funds in the Emerging Markets Equity space, there is a rather steep drop-off in terms of asset sizes in other ETFs in this segment. When we look at IEMG head to head against its more tenured cousin EEM (which debuted in 2003) fund literature suggests the following: “1) Exposure to a broad range of emerging market companies 2) Low cost, comprehensive access to stocks in emerging market countries and 3) Use at the core of a portfolio to diversify internationally and seek longterm growth.”
We see one thousand eight hundred ninety-three individual equities within the IEMG portfolio, as compared to only eight hundred forty-three in EEM as the funds track two different indices, the MSCI Emerging Markets Investable Market Index and the MSCI Emerging Markets Index respectively and it seems that iShares developed IEMG over time for more efficient and more specialized access to the MSCI Emerging Markets universe.
The low price tag with an expense ratio of only 0.14% versus EEM’s 0.67% is likely attracting not only retail but institutional portfolio managers as well, as IEMG seems intentionally priced on par with the larger VWO which debuted back in 2005. Notably, the combined assets under management of EEM and IEMG outpace VWO by about $6 billion presently.

The IEMG was trading at $48.19 per share on Thursday morning, up $0.04 (+0.08%). Year-to-date, IEMG has gained 13.52%, versus a 5.18% rise in the benchmark S&P 500 index during the same period.
IEMG currently has an ETF Daily News SMART Grade of A (Strong Buy), and is ranked #3 of 77 ETFs in the Emerging Markets Equities ETFs category.
