If you’ve been holding the Cohen & Steers Quality Income Realty Fund (RQI)—a fund I wrote about a lot in 2019—you’ve done very well indeed. RQI has dominated, with its market-price return surging 51.9%, including gains and dividends, since the start of 2019.
So today we’re going to take a closer look at this superstar fund to see what lies ahead, and whether it’s still worthy of your cash, even with its big 2019 gains.
If you’re not familiar with RQI, it owns real estate investment trusts (REITs), such as cell-tower owners Crown Castle International (NYSE:CCI) and American Tower (NYSE:AMT), warehouse landlord Prologis (NYSE:PLD) and data-center REIT Equinix (NASDAQ:EQIX).
To be sure, there are downsides to putting cash in RQI now, such as a dividend yield that’s been whittled down as the fund’s price has risen. RQI yields 6.5% today, behind the 7.1% average for all REIT funds and well below the 9.3% this fund yielded at the start of 2019.
What’s more, with a 50%+ return under its belt, it’s fair to wonder if RQI can deliver another big gain in 2020 or if it might give some of its 2019 win back.
Top-Notch Management Team Wins Again
Before we get into what might lie ahead for this superstar REIT fund, let’s talk about RQI’s wonderful 2019.
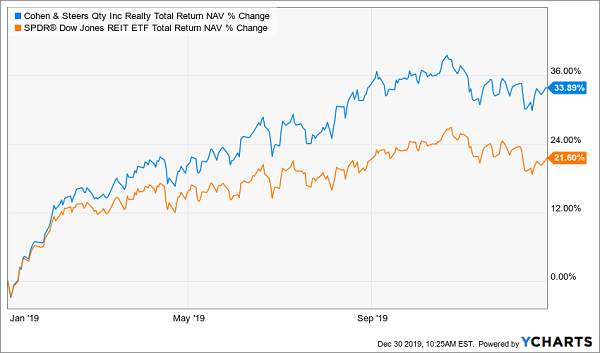
The big market-price rise is just part of the story. We also need to look at the fund’s total NAV return (or the performance of its underlying portfolio, including dividends) for 2019, because that tells us how RQI’s fund managers performed with their picks. Did this beat the index, and does it come close to RQI’s market returns?
On the first issue, there’s just no question.
RQI’s Picks Crush the REIT Sector

With a 34% total NAV return, RQI’s managers easily beat the broader REIT market, tracked above by the SPDR Dow Jones REIT ETF (NYSE:RWR), which itself actually underperformed the S&P 500 (a rarity, as REITs tend to outperform the broader stock market). That RQI both beat the REIT index fund and the SPDR S&P 500 ETF (NYSE:SPY) is a testament to how good RQI’s managers are, and how well they’ve leveraged their skills into a great return.

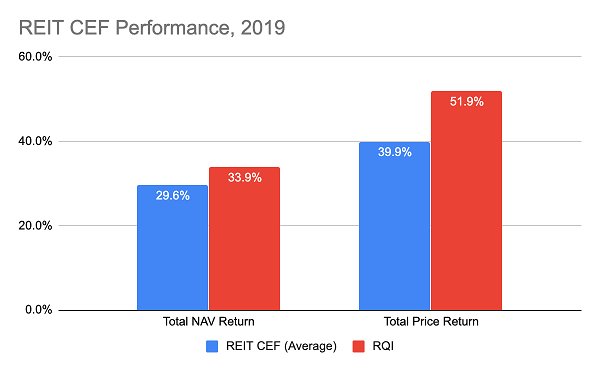
RQI’s return has also trounced the REIT CEF competition, although it’s less impressive, compared to its performance versus the index, on this front.
As I’ve written before, REITs are the kind of market where an active manager with an in-depth knowledge of real estate can easily crush an index fund like RWR, which uses an algorithm to make selections. As a result, all of the well-managed REIT CEFs have posted average returns above the index by a wide margin, yet RQI has beaten them all by a fair bit.
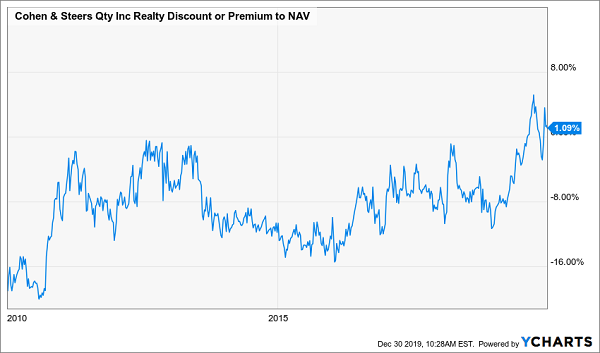
There’s just one problem, as you can see from the bars on the right side of the chart above: investors have amply rewarded RQI for its huge returns. As a result, RQI’s premium to NAV is near a 10-year high.
A Sudden Premium Appears

RQI consistently traded at a discount over the last decade until earlier in 2019, although its premium briefly disappeared as investors balked at this sudden change of fortune. If RQI’s performance dips in 2020, they could balk again.
REITs in 2020: A Look Ahead
Of course, whether RQI’s performance dips in 2020 or not depends a lot on what happens to REITs as a whole.
REITs’ Solid 2019

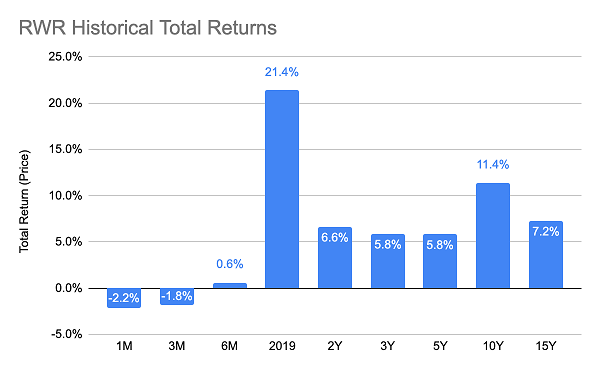
As you can see above, even though RWR slightly underperformed the S&P 500 in 2019, it still posted a very strong return. You can also see that this huge return is an extreme outlier, which would seem to make a reversion to the mean more likely in 2020.
But there’s a big catch: there was a very good reason for 2019’s tremendous return, and it’s something we should consider, as well: the Federal Reserve.
At the end of 2018, REITs were particularly hard hit by the Fed’s continued interest-rate hikes, which went far beyond the market’s expectations and hurt many REITs, as investors worried this would raise their borrowing costs.
As a result, they overreacted to the downside, creating a real opportunity to snap up REITs at great prices when the Fed reversed course and said it would start cutting rates. Several cuts later, and REITs have returned to their long-term trend of about 7% to 8% annualized returns.
If the Fed doesn’t cut rates further in 2020, or cuts just once, like the market expects, then we could see an in-line trend of about 7% or 8% gains for REITs as a whole. (And I expect the discounted REIT CEFs in our CEF Insider portfolio to do even better than that.) If RQI’s NAV returns beat that, expect investors to stay pretty happy, and for RQI’s market price to follow along those lines.
4 Picks to Beat RQI in 2020 (and pay you 35% more income, too!)
So what’s the bottom line? Simple: RQI is a good pick if you want to match the market in 2020. Heck, you might even beat it by a little bit.
But we can do better with the 4 CEF picks I have waiting for you right here. These funds yield far more than RQI right now—an outsized 8.4% dividend, on average—and trade at much bigger discounts, too.
How big?
I’m forecasting 20%+ price upside from each of these rock-solid picks in 2020. That’s in addition to their huge 8.4% dividends!
So you could be looking at a 30% total return in just one year here!
And because you’re diversifying across 4 funds here (which hold REITs, bonds, US and overseas stocks), you’re getting an extra margin of safety compared to an all-in wager on RQI, thanks to the diversification in this 4-fund “mini-portfolio.”
That, plus these funds’ wide discounts, nicely position you for big gains if 2020 is another boom year—and help shield your nest egg if the market takes a header.
Disclosure: Brett Owens and Michael Foster are contrarian income investors who look for undervalued stocks/funds across the U.S. markets. Click here to learn how to profit from their strategies in the latest report, "7 Great Dividend Growth Stocks for a Secure Retirement."
