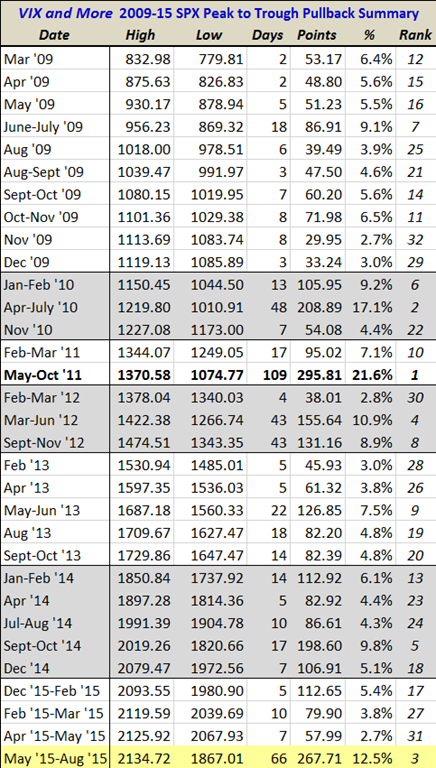
Nary a pullback goes by without at least a handful of requests to update my pullback table to help put the current pullback in perspective. Whether the current market action is best described as a pullback, correction or even bear market, I am happy to oblige.
For those who may be new to this graphic, note that the table below includes only S&P 500 Index pullbacks from all-time highs and only those that go back to the March 2009 bottom. (Due to the all-time high requirement, I count back to the May 20th intraday high of 2134.72, even though almost all of the damage has been done in the past three days.) In terms of defining the minimum pullback for the table, here 2.75% seems to be a natural cutoff, but I am more apt to include smaller numbers if it took a relatively large number of days to arrive at the bottom. Of course the current move does more than just squeak in: it is now the third largest in terms of magnitude at 12.5% and second longest from peak to trough, at 66 days.
Worth noting is that the #1 pullback (21.6% in 2011) saw a peak VIX of 48.00 during the decline, while the #2 pullback (17.1% in 2010) coincided with a maximum VIX of 48.20. The current pullback falls into the #3 slot, while the #4 pullback (10.9% in 2012) saw a maximum VIX of only 26.71. For the record, yesterday’s VIX intraday high of 53.29 is the highest VIX on record outside of the 2008-2009 financial crisis, with data going back to 1990.

While there is no obvious proximate cause of the current pullback and VIX spike, it is clear that concerns about slowing growth in China is the main source of investor anxiety. Investors are clearly uneasy about various sub-plots related to the real level of China’s GDP, the impact of slowing Chinese growth on commodities and related markets, speculative excess and bubbles in China’s domestic stock market (Deutsche X-trackers Harvest CSI 300 China A-Shares (NYSE:ASHR)) and real estate market (Guggenheim Invest China Real Estate (NYSE:TAO)) or broader concerns about the ability of the Chinese government to manage the economic transition from infrastructure-driven growth to growth based on domestic consumption.
Sharp selling and higher volatility has been present for many months in commodities and currencies. Only recently has the selling and higher volatility spilled over into Chinese equities and emerging markets as a whole. In fact, emerging markets have suffered greatly as of late, with the popular iShares MSCI Emerging Markets ETF (NYSE:EEM) plummeting during the last two weeks and now down 32% from its April high. At the same time, the CBOE Emerging Markets ETF Volitlity Index (VXEEM) soared to record of 111.39 on an intraday basis yesterday, crushing the previous all-time high of 86.44.
As with all big pullbacks, at this point we only know that we are closer to a bottom and have no assurance that the current bottom will hold. Most likely it will be tested again today and perhaps in the next day or two and traders will take their cues based on how well SPX 1867 holds up as support.
Disclosure(s): long EEM at time of writing
