Admit it. You are feeling a little bit edgy these days. While you understand that fear is the elixir of investment opportunity, you also recognize that there is little glory for the last person standing on a sinking aircraft carrier.
Most in the media have been touting bull market accomplishments, job gains and economic progress. Writers regularly highlight the monster percentage gains that U.S. stocks have enjoyed since the lows hit in March of 2009 rather than discuss the reality that U.S. stocks have yet to recover inflation-adjusted highs set in March of 2000. Similarly, commentators typically celebrate monthly job growth of 200,000 without an acknowledgement that jobs paying an average of $62,000 per year have been replaced by those paying about $47,000 per year. It follows that inflation-adjusted wages have been stagnant since the recovery’s inception. And economic progress itself? Analysts often dismiss the dismal (1st quarter contraction), hype the cheerful (better-than-anticipated 2nd quarter expansion) and ignore year-over-year deceleration from 2012 to 2013 to 2014.
I have made the case before that the U.S. economy is like a tricycle. By way of review, its back two tires – inflation-adjusted family income and working-aged individuals in the labor force – have been flat for five-and-a-half years. That means the ultra-fat front tire – Fed-fueled credit for lending-n-spending – is wholly responsible for the country’s annualized expansion of approximately 2%. Instinctively, investors grasp that an end to quantitative easing as well as its partner-in-crime (i.e., zero percent interest rates) represent the equivalent of a slow leak in the front tire. It makes participants sketchy and it encourages them to pile into long-maturity Treasuries as well as gold and the greenback.
Granted, the uncertainty surrounding Fed policy is only one thing that asset allocators have to ponder. Worldwide geopolitical tensions are increasing, euro-zone members are still battling recessionary pressures, U.S. retailers are struggling, home sales are experiencing sales volume declines and job erosion at banks may be damaging the sub-sector’s stock shares. Nevertheless, the S&P 500 is a mere 2.2% off its nominal record peak at the time that I am writing this article.
Still, scaling back on extreme risk-taking is sensible and proactive. Building a cash position for buying shares lower is a way to take advantage of oversold conditions. In contrast, a “buy-every-dip” mentality works until it does not work. And probability alone suggests that a more substantive sell-off would provide a better chance to acquire beaten down shares.
Here are 5 charts that should give uber-bulls reason to reconsider their premises:
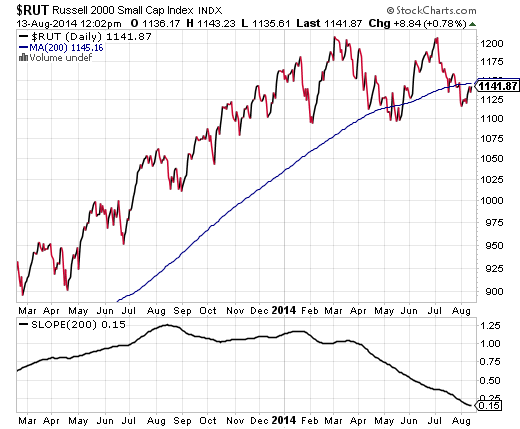
1. Small Caps Are Technically Weak and Ridiculously Overvalued. Market technicians would harp on the March and July peaks for the Russell 2000 that appear to have formed a “double-top.” Trend followers will simply remind us of the breach of key trendlines like the 200-day moving average. Myself? Year-to-date losses, unsustainable P/Es as well as a slope indicator that is poised to go negative have been keeping my allocation to U.S. small-caps at a negligible level (0%-5%).
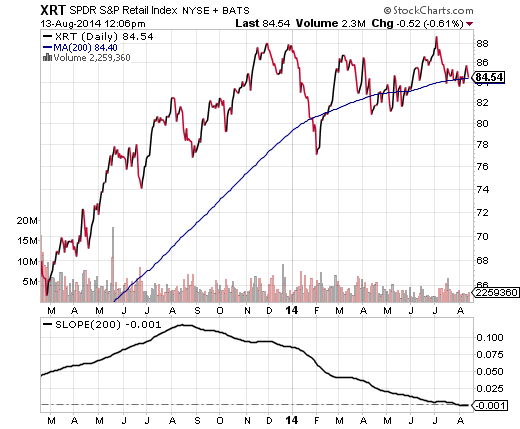
2. Retail Stocks Continue To Sing The Blues. Retailers logged their weakest showing in six months. In the absence of wage growth, is it any surprise that consumers are holding back? What’s more, ETFs like SPDR S&P Retail (NYSE:XRT) have posted negative returns year-to-date, while the slope of its 200-day recently traveled into negative territory.
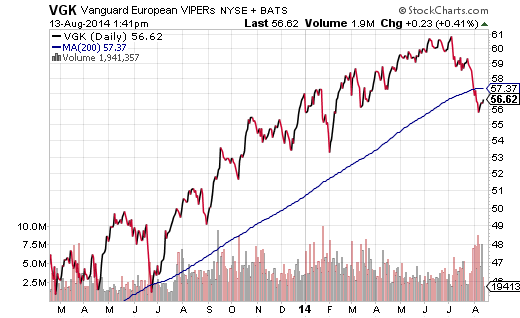
3. European Economy Needs Another Central Bank Infusion. Germany was once the powerhouse that kept the European economy out of harm’s way. France could often be counted on to contribute as well. But lately? Both of the euro-zone’s stalwarts are decelerating. Meanwhile, Portugal’s banks are under fire and Italy has ushered in another official period of recession. The number of European country ETFs struggling with a technical downtrend is worrisome, including iShare MSCI Germany (ARCA:EWG), iShares MSCI France (ARCA:EWQ), iShares MSCI Italy Capped Fund (ARCA:EWI), Global X FTSE Greece 20 (NYSE:GREK), iShares MSCI Switzerland Index (NYSE:EWL), iShares MSCI Poland (NYSE:EPOL), iShares MSCI Sweden (NYSE:EWD) and iShares MSCI Austria (NYSE:EWO).
4. Wither the Banks? One of the primary goals of quantitative easing and zero-percent interest rates was to give banks an opportunity to borrow on the ultra-cheap and lend out the money profitably. There’s been some of that, of course. However, banks have been far more stringent with consumers than with businesses. And in many cases, banks have chosen to park the Fed’s electronic credits/dollars in reserves for an exceptionally modest, albeit guaranteed, rate of return. So if borrowing from the Fed for next-to-nothing did not encourage banks to supply loans because of perceived risk-return concerns or insufficient demand, why would the end of those policies be a net positive for the big banks? There may be an economic theory to suggest that it would be, but faith in the SPDR KBW Bank Index Fund (NYSE:KBE) tells a different story.
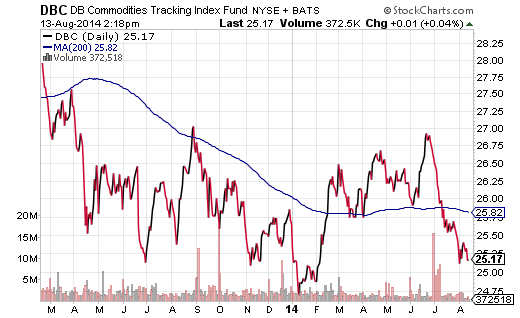
5. Commodities Are Showing Little Faith In The Global Economy. Commodities as an asset class suffered alongside emerging markets for the same three-year period (i.e. 2011-2013). The thinking? The BRIC (Brazil, Russia, India, China) engine that had been powering the global economy had slowed dramatically, dampening demand for “stuff.” In 2014, though, emergers have rallied back with a vengeance. China, India and even Brazil have been showing signs of turnaround. Yet commodities are still thrashing about aimlessly. Is it deflation in Europe? Is it underlying weakness clear across the West? Whatever it is, it is not pretty.


