A learned blockhead is a greater blockhead than an ignorant one.
-- Benjamin Franklin
Since the markets bottomed in 2009, one naysayer after another has penned many an obituary for this market. Alas, all those obituaries were based on fantasy and false perceptions -- the bull is alive and kicking while many of those experts are either bankrupt or have bankrupted their clients several times over. We repeatedly stated over the years that the era of low interest fostered an environment that favored speculation over hard work. Which is why so may companies have opted to boost EPS via share buyback programs. Why work, when through the magic of accounting you can create the impression of growth when there is none?
Despite the latest rate hike and ramblings from the Fed that they are ready to raise rates more aggressively, the reality is the economy is sick and only appears to be thriving because of the hot money that is being funneled into the markets. This helps foster the illusion that all is well when in reality, everything is falling apart. Hence, while the Fed talks big, its bite will be weak. The trend of hot money is in play and until the supply is cut, this bull market will continue to trend higher. But it won't trend higher forever; eventually it will run into a wall. There is no point of fixating on what will happen one day when it's far more profitable to focus on the now.
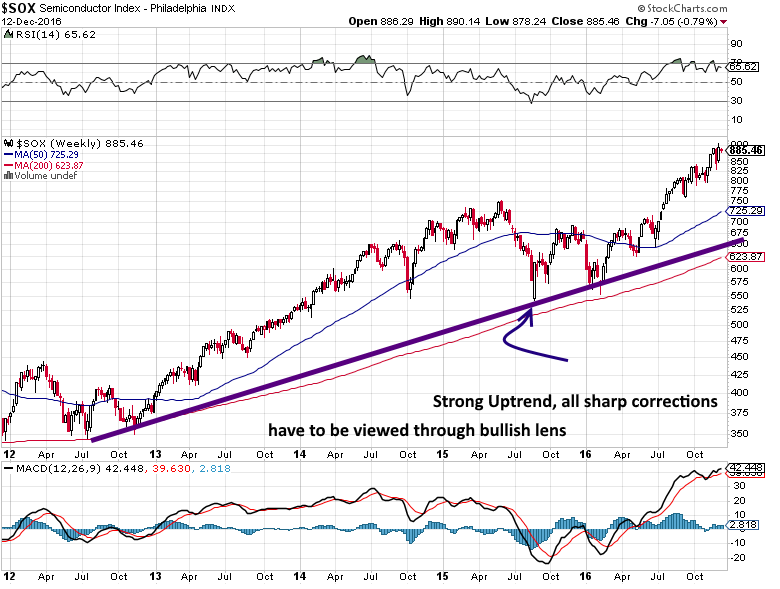
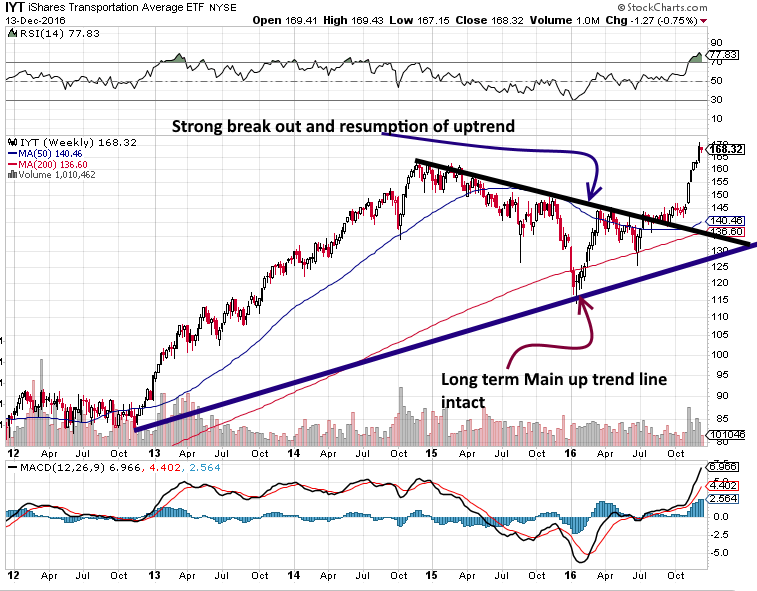
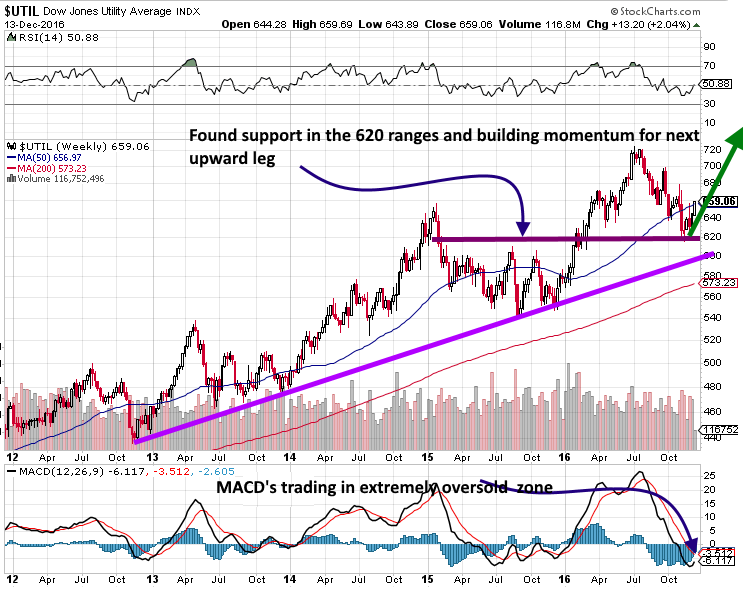
The three charts below illustrate why this bull market still has legs.

The semiconductor sector needs to be in a strong uptrend for a market to rally on a prolonged basis. A quick look at the above chart (semiconductor index) shows that the index is in a very strong uptrend. It is trading above its main uptrend line and has continued to trade to new highs over the past five years. It could drop all the way to 650, and the outlook would remain bullish.

IYT -- the ETF that mimics Transports -- is trending upwards again after experiencing a nice cleansing correction. A monthly close above 165 will pave the way for a test of the 195-205 ranges.
Finally, as we stated in the alternative Dow theory, the utilities appear to be getting ready to trend higher.

As they exit a correction, they are likely to play around the 625-640 ranges for a bit before breaking out. The utilities lead the way up, so a breakout to new highs should be watched closely. If they break out to new highs, it would indicate that after a correction that could range from mild to strong, the Dow Jones Industrial Average should follow the same path.
Conclusion
This bull market will end but that day is not upon us yet. The hot-money supply has to be eliminated and more importantly, the masses have to embrace this bull market. Over the short term, the markets have gotten slightly ahead of themselves and so some bloodletting probably next year would not surprise us. However, a correction and a crash are not the same things, something the naysayers have a hard time recognizing. When the markets start to pull back again, they will feel emboldened and crawl out of the woodwork screaming the same rubbish they always do. Don’t listen to them; we can even provide a small preview of what will happen.
The trend is your friend and rubbish your foe.
Trend wisely.
