Let’s face it, some days are better than others. As it turns out, some weeks are worse than others. Particularly in the stock market. Let’s take a closer look.
Bad Weeks
For the record, this piece is inspired by a study done by Rob Hanna of QuantifiableEdges.com. The truth is what appears here may be a study of the subject that is inferior to the one Rob did originally. But I couldn’t find my copy of his original study, so for better or worse, I started crunching numbers on my own.
This study uses weekly closing prices for the S&P 500 index going back to October 27, 1967. The Nasty 7 are the week after:
Note that not all of these weeks occur every year (specifically February and July only occasionally have 5 Fridays). Also, it is interesting to note that three of the weeks follow option expiration weeks (March, June and September).
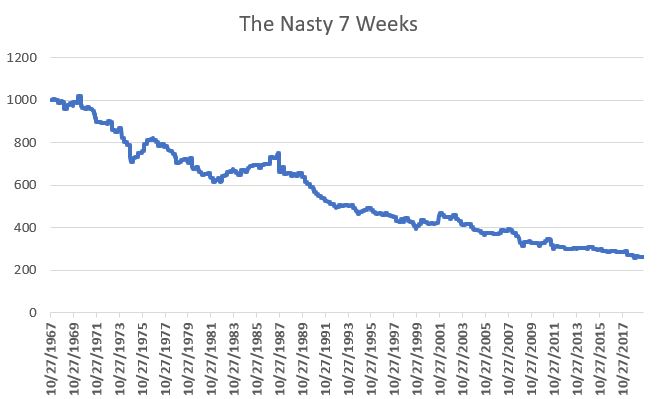
So how bad are these 7 weeks? Let’s put it this way. If you started with $1,000 in 1967 and all you ever did was buy and hold the S&P 500 ONLY during these 7 weeks every year your equity curve would look like Figure 1.

Figure 1 – Growth of $1,000 invested in S&P 500 Index only during the Nasty 7 weeks each year; Oct 1967-Aug 2019
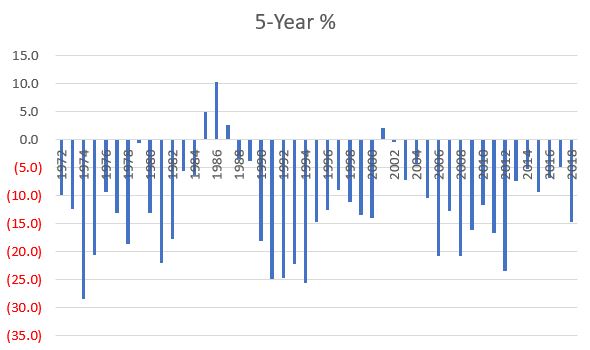
The cumulative loss from holding the S&P 500 Index only during these weeks was a fairly significant -73.7%. Figure 2 displays the rolling 5-year return from following this “strategy”.

Figure 2 – Rolling 5-year % return for Nasty 7 weeks; 1972-2019
For the record, only 4 of the 51 five-year rolling periods showed a gain.
Clearly, the moral of the story is “don’t do this.” But what if we “flip it on it’s head” and do the opposite, i.e., what if we hold the S&P 500 for all weeks EXCEPT these 7 weeks each year?
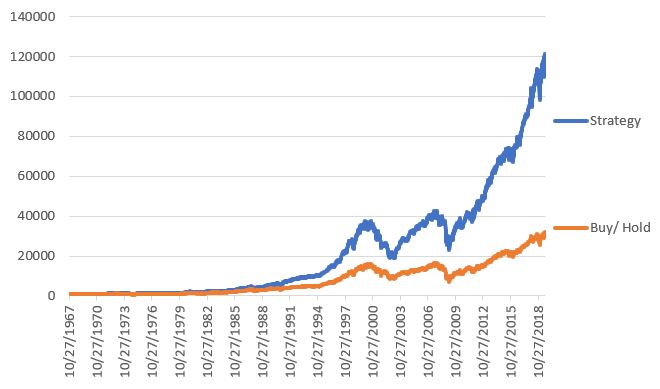
The equity curve for this strategy (and for buying and holding the S&P 500) appears in Figure 3.

Figure 3 – Growth of $1,000 invested in S&P 500 during all weeks EXCEPT Nasty 7 (blue line) versus buying and holding S&P 500 Index (red line); 1967-2019
The Bad News is that you still “took your lumps” during some of the major bear markets that occurred along the way. The Good News is that $1,000 grew to $114,031 using this approach versus $29,982 for buying and holding the S&P 500.
Summary
Is this really a viable strategy? Bottom line: it’s not for me to say. I am still of that Old School journalistic “We report, you decide” mentality (as opposed to most modern journalism which is more of the “We decide, then we report our decision” modus operandi).
