Highlights
- Market Movers: Weekly Technical Outlook
- Can Europe save the market from China fears?
- What’s up with the dollar?
- Look Ahead: Stocks
- Look Ahead: Commodities
- Global Data Highlights
Market Movers: Weekly Technical Outlook
Technical Developments to Watch:
- EUR/USD testing minor resistance at 1.13 – potential for more strength toward 1.14
- GBP/USD pressing top of recent range at 1.5680
- USD/JPY rolling over – bias bearish below previous support at 123.00
- AUD/USD in play, watching for a breakout from .7250-.7450 range on economic data

* Bias determined by the relationship between price and various EMAs. The following system determines bias (numbers represent how many EMAs the price closed the week above): 0 = Strongly Bearish, 1 = Slightly Bearish, 2 = Neutral, 3 = Slightly Bullish, 4 = Strongly Bullish.
** All data and comments in this report as of Friday afternoon **
EUR/USD

- EUR/USD extended its rally on the broad-based dollar weakness last week
- MACD showing a shift to bullish momentum, but Slow Stochastics now overbought
- Potential for a rally back toward 1.1400 if minor Fib resistance at 1.1300 is overcome
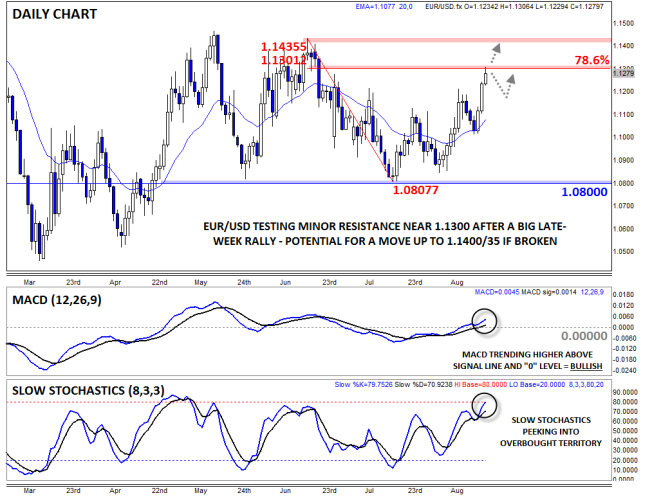
EUR/USD extended its rally last week, surging nearly 300 pips over the final three days of the week (as of writing) on broad-based US dollar weakness. The previous bearish momentum has clearly evaporated at this point, with the pair now trading at a two-month high near 1.1300. Not surprisingly, the MACD indicator is now showing bullish momentum, though the Slow Stochastics is peeking into overbought territory. If bulls are able to overcome minor 78.6% Fibonacci retracement resistance near 1.1300, a continuation toward 1.1400 is likely next.
Source: FOREX.com
GBP/USD

- GBP/USD inched higher along its 20-day EMA last week
- MACD shows modest bullish momentum, Slow Stochastics approaching oversold territory
- Bulls want to see a conclusive break above previous resistance at 1.5680
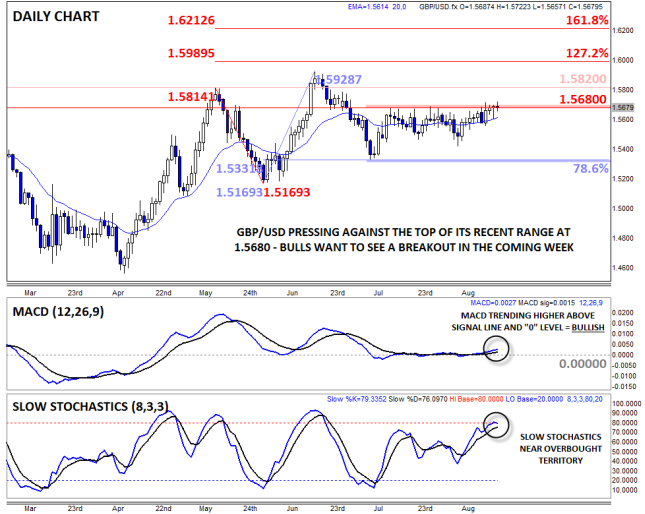
GBP/USD edged higher within its near-term range early last week, testing resistance at 1.5680 consistently, but the pair was unable to break conclusively above that key level. The pair consistently found support along its 20-day MA, and with the MACD now showing modest bullish momentum and the Slow Stochastics not yet in overbought territory, a breakout is possible this week. If bulls are able to overcome 1.5680 resistance, a move up toward 1.5800 or 1.5900 could be seen next.
Source: FOREX.com
USD/JPY

- USD/JPY rolled over to fall sharply late last week
- MACD showing bearish momentum, but Slow Stochastics now oversold
- Potential for a deeper retracement toward 122.00 or 121.00 next
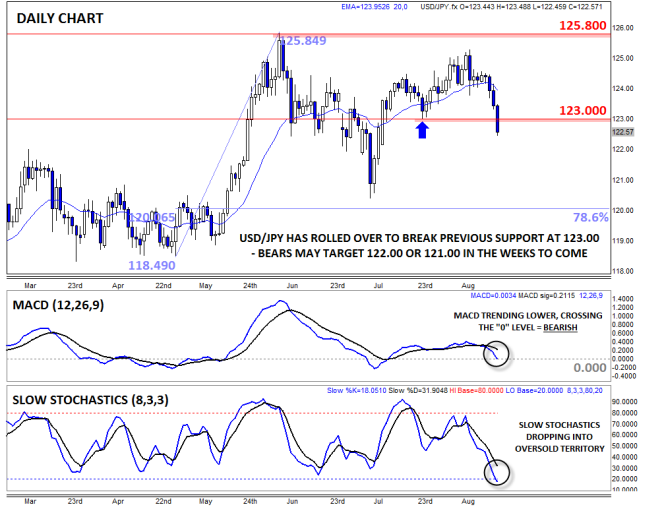
USD/JPY rolled over to break below previous support at 123.00 last week, caught up in the late week waves of US dollar selling. Not surprisingly, the MACD indicator is now showing clearly bearish momentum, though the Slow Stochastics are now in oversold territory. That said, there is not much in the way of previous support nearby, so as long as the pair holds below 123.00, a continuation down toward 122.00 or 121.00 is in play this week.
Source: FOREX.com
AUD/USD

- AUD/USD edged lower in quiet trade last week
- MACD reverting back to the “0” level
- Traders watching the 200-pip range from .7250 up to .7450
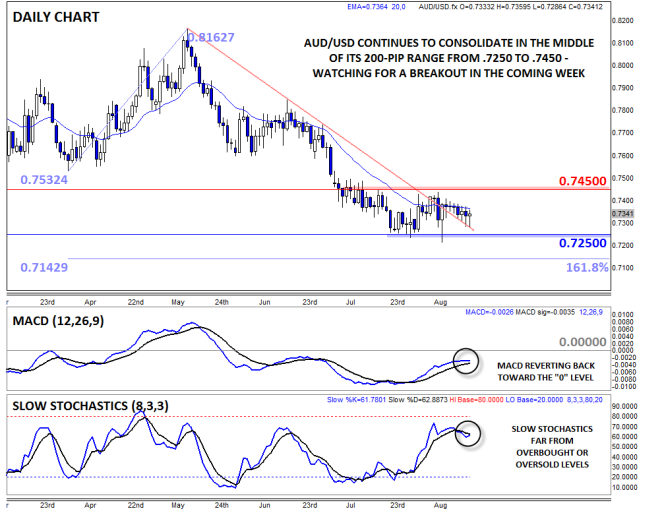
AUD/USD is our currency pair in play this week due to a number of high-impact economic reports out of the US and Canada in the coming week (see “Data Highlights” below for more). Despite the general US dollar weakness, the Aussie failed to rally against the greenback this week, with AUD/USD merely consolidating in the middle of its recent .7250-.7450 range. Meanwhile, the MACD is gradually reverting back toward the “0” level and the Slow Stochastics indicator is far from overbought or oversold territory. Traders will be watching for a breakout from the 200-pip range, given this week’s busy economic calendar.
Source: FOREX.com
Can Europe save the market from China fears?
It’s been a tale of two halves this Friday morning. The market was spooked by a global stock market sell-off that saw stocks plunge to their lowest level in months, and some EM currencies drop to fresh record lows. This move was initially exacerbated by the very weak reading of Chinese PMI for August. This was a flash estimate that saw the Chinese manufacturing index plunge to its lowest level since the peak of the financial crisis in 2009.
So what is driving this move lower, and is it justified?
Global growth fears are the chief concern for the market right now. If China catches a cold, the higher-risk markets like stocks and EM FX are assuming that the rest of the world will catch a cold as well. However, earlier this morning we had European PMI data, which surprised to the upside. Germany led the surge higher, posting its highest composite PMI reading since April, which pushed the overall Eurozone reading to 54.1, a notch lower than its highest reading of 54.2.
Interestingly, China’s growth slowdown has yet to impact Europe’s recovery story. The UK is also growing at a decent rate and the US is still producing jobs at a 200k-per-month pace. So why isn’t strong growth in important developed markets cancelling out, or at least neutralizing, the negative impact from China?
The reason, in our view, is that the market cannot balance this dichotomy to global growth. On the one hand, a weak Chinese economy could weigh on commodity demand and also throw into doubt the strength of Chinese consumption, which could hurt key export economies like Japan, Australia and other emerging markets. On the other hand, a strong developed economy, particularly in the US, UK, and Europe, could make the prospect of central bank tightening a reality in the coming months.
A toxic mix…
This mixture of Chinese demand slowing and potential central bank tightening in the US and UK is proving to be toxic for financial markets, but will it be as bad as it was in 2008/09?
We think not, for a few reasons. Firstly, this market turmoil has reduced the chances of a rate hike from the Fed; the Fed Funds futures market is now pricing in a mere 32% chance of a hike next month. Secondly, China has the money to add some stimulus to its economy and make up for the liquidity shortfall even if the Fed does go ahead and hike sometime this year.
If there is one thing that markets like it is liquidity. With the Fed remaining tight-lipped on the prospect of a rate hike in the next few weeks, the markets are likely to focus on China and the prospect of more stimulus. Watch out for any injection of stimulus this weekend (China tends to make policy changes at the weekend); they could cut interest rates or even do something more radical such as announce a new stimulus program. We doubt that China will choose to devalue its currency again after the turmoil of last week’s de-val, which caused a panic in global markets.
If China does inject some stimulus into its economy, then we could see risky assets stage a strong rebound at the start of next week; if it fails to act, then we could see a continuation of the decline. So, events in the next 48 hours could determine the tone of markets at the start of next week.

Source: FOREX.com
What’s up with the dollar?
The dollar was once considered a safe-haven; however, during the recent bout of market panic, when stock markets like the DAX have had their biggest weekly decline since September 2011, the buck has had a torrid time versus other G10 currencies.
We should add a caveat here. There has been a vast contrast between the performances of the dollar versus EM currencies, some of which have fallen to fresh record lows vs. the greenback, and the performance of the buck vs. the G10. For this piece, we will focus on the G10 space, as the selloff in the EM FX sphere is fairly easy to understand.
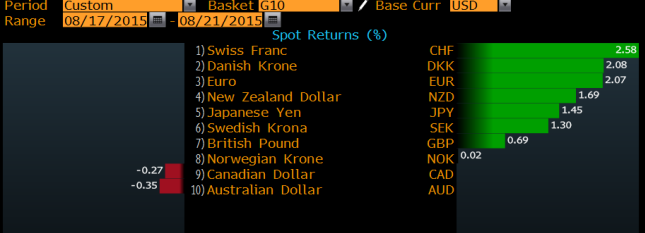
As you can see in the table below, the dollar has fallen against all G10 currencies, apart from the Aussie dollar. It is mostly flat vs. the NOK and the CAD. The weakness in dollar was most marked vs. the CHF and the EUR, while the bout of Chinese-inspired risk aversion triggered the upswing in the CHF, the strength in the EUR is harder to justify.
The EUR experienced a strong rebound in the second half of last week after Fed minutes were considered dovish and a strong Eurozone PMI reading for August helped the single currency to extend gains. As we write this on Friday evening, EUR/USD was only 40 pips away from its 200-day moving average – a critical resistance level. It appears that the FX market is able to shrug off fears about a new Greek election, which was announced last week. Instead,Greek fears have mostly manifested themselves in domestic markets like the local stock and bond markets.
The erratic performance of the dollar highlights the myriad influences on the FX market in recent days, including:
- The selloff in commodity prices, which has weighed on the Aussie
- The risk aversion emanating from the East, which has boosted safe havens like the CHF and JPY
- The market’s reduction of its expectations for a rate hike from the Fed in September (the Fed Fund Futures market is only expecting a 32% chance of a hike next month)
The decrease in expectations that the Fed will hike interest rates next month has given a boost to currencies such as the SEK, which one normally associates with selloffs during periods of market risk aversion. Instead, the SEK rocketed at the end of last week after the Riksbank (Swedish central bank) said that it does not have a target for the SEK and the economy is doing well. In this environment, the market considered the comments to be hawkish and we saw a large upward move in the SEK.
As we start a new week, EUR/USD is looking strong, especially if it can break above the 1.1337 level – the 200-day sma. But EUR bulls beware, since EUR tends to have an inverse correlation with stocks, if global stock markets stage a rebound this week then it may be tough for the EUR to sustain last week’s gains.
G10 FX Spot returns vs. the USD
Source: FOREX.com
Look Ahead: Stocks
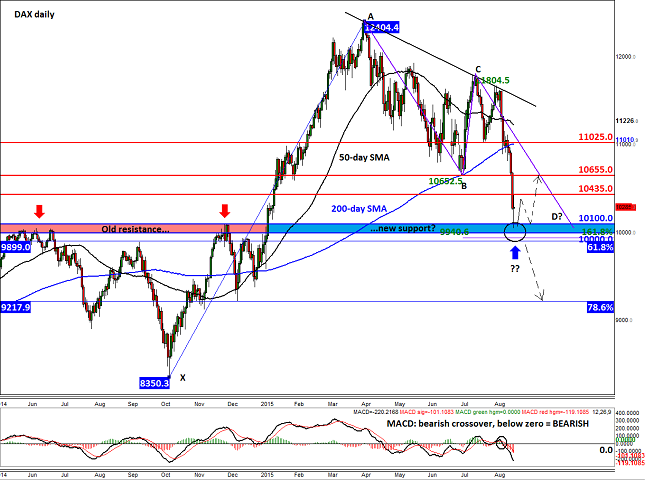
It has been a very bad week for the global equity markets with the major indices falling viciously as worries over the health of the Chinese economy intensified. Concerns over Greece have come back to the forefront after Syriza leader Alexis Tsipras stood down as Prime Minister on Thursday, paving the way for new elections and more uncertainty. Admittedly, some of the selloff can be explained away by market noise as more and more buyers were forced to exit their positions to meet margin requirements and fresh sellers came into play to take advantage of the momentum. But if it is indeed just noise then we will need to see the indices turn around and create reversal patterns on their charts around these technically-important levels. On Friday when this report was written, the S&P 500, for example, was testing its bullish trend line that has been in place since October 2011 around 2020, while in Europe the German DAX index was hovering dangerously above the key 10,000 hurdle – more on this later. If the indices do not find strong buying interest around these levels, then we may be in the process of a much larger correction. Worryingly for the stock market bulls, it is not just equities that are in a free fall; emerging market currencies are tumbling too, as are oil prices due to the relentless growth in supplies. Should oil prices head further lower then this could weigh heavily on energy stocks in particular, next week.
One potential source of support for the stock markets may come in the form of central bank intervention. The People’s Bank of China is known for its role in intervening when the markets are closed. Going into the weekend, traders will need to be wary of this possibility. Another factor that could support equities is QE and the on-going record low levels of interest rates across the major economies. The FOMC’s meeting minutes that were released earlier in the week revealed the Federal Reserve was already less hawkish than expected in July. Given that CPI grew only marginally in July and other deflationary pressures have since developed, mostly notably from the renewed selling pressure in crude and China’s decision to sharply devalue its currency last week, the Fed is highly unlikely to raise rates in September and may even hold off in December if price pressures recede further.
That being said, the sentiment is downbeat at the moment and the momentum is clearly to the downside with the DAX index having had its largest weekly decline since September 2011. The German benchmark has already created several bearish signals including the breakdown of key support at 10655. Going forward traders will need to watch this level as it could turn into resistance upon re-test (short-term bias would turn bullish if it doesn’t). On the downside, the area around the psychologically important 10,000 is a major support zone. As can be seen from the chart, the 9,900-10,100 area was formerly resistance and on Friday it turned into support, leading to a bounce from a low of about 10,055 in overnight trading to a high of 10435 (about 385 points, no less). But was this a mere short-covering bounce or a bottom? The answer to this question will be answered by the eventual break above 10,655 resistance or below 9,900 support.
So why is the 9,900-10,100 range very important? As already mentioned, this area was a strong resistance zone in 2014, so it could be the new support this year. What’s more, the point D of an AB=CD pattern also completes inside this support range. On top of this, there are two key Fibonacci levels coming into play around 10,000: the 161.8% extension level of the corrective up move in July at 9940 and the more significant 61.8% retracement of the up move from October at 9900. Thus, the probability that the market could find a base around 9,900-10,100 area is high. But, if it doesn’t, then it is anyone’s guess how far the DAX may fall and where it may bottom. Though the economic calendar is light on Monday, volatility in the stock markets should remain high. In other words, there will be lots of trading opportunities to take advantage of.
Source: FOREX.com. Please note this product is not available to US clients
Look Ahead: Commodities
Judging by gold’s $90 rally since July and the $50 gain over the past three days alone, it would appear that the metal has regained its status as the ultimate safe-haven asset. Equities have come under severe pressure in recent days (for detail, see the stocks section above), with the US and European indices joining the Chinese market turmoil. Sentiment has been hurt in part because of renewed concerns about the health of the world’s second largest economy. The Flash Manufacturing PMI for China fell again in August to hit its lowest level since March 2009. The latest European PMIs were not great either, pointing to subdued demand for Chinese exports. What’s more, the central bank fiat currency ‘war’ has been re-ignited by China and now the Federal Reserve is looking increasingly unlikely to hike rates in September and maybe even December. The weaker US dollar is providing additional support for gold.
But on Friday morning when this report was written, the precious metal was actually lower even though stocks extended their decline. However, it remains to be seen if the sellers will be able to hold their nerves for too long given the dual impact of the falling stock prices and a weaker US dollar. Indeed, Friday’s weakness could be inspired by profit-taking ahead of the weekend and as the metal has reached the bearish trend line at $1168 and as the RSI neared the ‘overbought’ threshold of about 70. Thus, gold could bounce back during the late New York session or early next week.
If the metal manages to break above the bearish trend line, it would be a very bullish technical outcome as it would also confirm the break out from a potential falling wedge bullish pattern. That being said, gold does tend to respond very well to the 61.8% Fibonacci level, which hasn’t been tested yet at $1173 (this is derived from the downswing that began in May). A decisive break above the $1173 level could then see the metal go for the next key resistance around $1225/30, before making its next move.
Conversely, if the bearish trend continues to hold as resistance then there is potential for another sharp move lower from here, with the first key level of support coming in at $1125/30.

Source: FOREX.com. Please note this product is not available to US clients
Global Data Highlights
Tuesday, August 25
0300GMT - NZ inflation expectations (Q2)
The RBNZ releases its two-year inflation expectations, which are an important gauge of where the bank believes prices are heading. Consequently, it’s a solid look into the minds of policy makers in NZ, providing an important gauge of where monetary policy may be heading. Another soft print could further swamp the kiwi.
0600GMT – German final GDP (Q2)
The preliminary figures, released mid-August, suggested that the economy rose 0.4% in Q2 q/q, missing an expected 0.5% increase. This time around the market isn’t expecting the final numbers to change from the flash figures, but another miss could erode some recent optimism that has built up in the Eurozone and the euro.
0800GMT – German IFO Business Climate (August)
Business confidence in the heart of the Eurozone improved in July, albeit only mildly to 108.00, defying expectations for a drop. In August, the market is expecting a drop to 107.5 in the primary index and in IFO expectations to 102.00 from 102.4.
2245GMT – NZ trade balance (August)
The waning price of key commodity prices has been weighing heavily on trade-exposed sectors and the economy in general. This time around the market is expecting the deficit to widen to 650 million from a 60-million deficit, underpinned by a large slump in exports. Imports are expected to increase 4.4bn and exports are anticipated to climb only 3.85bn.
Wednesday, August 26
1230GMT – US durable goods orders (July)
Businesses have been boosting their spending on long-lasting manufacturing goods, which is a key indication of overall corporate sentiment. New orders for durable goods rose an encouraging 3.4% in June, after slumping for the previous two months. In July, the market is expecting the headline index to fall 0.4% m/m and core durable goods to rise 0.2% m/m.
Thursday, August 27
0130GMT – Australian Private Capital Expenditure (Q2)
It’s no secret that Australia’s economy is struggling from a lack of corporate investment. The traditional heart of the economy, mining related sectors, has been pinned down by falling commodity prices and a general lack of global resource demand. Meanwhile, non-resource parts of the economy have failed to pick up the slack, so the RBA has stepped in to support the broader economy. In Q2, private CAPEX is expected to fall 2.5%; it’s also worth keeping an eye on business investment intention numbers in the report.
1230GMT – US Secondary GDP (Q2)
The second release of US Q2 GDP is expected to build on the Fed’s case for tighter monetary policy in the coming months. The first reading showed an encouraging 2.3% q/q annualized growth rate and the pace of growth in the first quarter was revised higher to 0.6%. The second release is expected to show that the economy expanded at an annualized q/q pace of 3.2%, with personal consumption increasing 3.1%.
1230GMT – US unemployment claims (August 22)
Due out at the same time as US GDP figures is the latest set of initial jobless claim numbers. US initial jobless claims have steadily been trending lower since the beginning of 2009 and are now hovering below pre-crisis levels, and the market won’t want to see a reversal of this trend.
2330GMT – Japan inflation (July)
The Japanese economy is still suffering, despite the best efforts of the Bank of Japan. In July consumer prices are only expected to increase 0.2% y/y and core-prices are anticipated to fall back into deflationary territory. The BoJ has said it won’t respond to temporary threats to inflation, but what was thought to be only temporary drags on inflation earlier in the year are looking more permanent, increasing the BoJ’s motivation to loosen monetary policy further.
Friday, August 28
0830GMT – UK second estimate GDP (Q2)
The UK is due to release its second estimate of Q2 growth, along with some expenditure and income data. The growth rate of the economy last quarter is expected to be finalized at 0.7% q/q and 2.6% y/y, with a 0.8% increase in private consumption and a 0.3% fall in government spending.
1230GMT – US personal income and spending (July)
Consumer spending in the US accounts for around two-thirds of all economic activity; thus, it’s a very important gauge of the overall health of the economy. In July, the market is expecting personal income to have increased 0.4% and retail spending to also jump 0.4%, after rising 0.4% and 0.2% in June.
