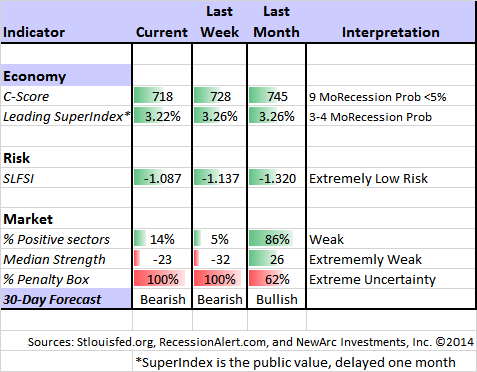
Was that the bottom? Nearly everyone is trying to time the market, so the financial media will focus on remaining risk versus signals of a bottom.
We have a little economic news next week, but plenty of earnings reports. Despite the news flow, the market reaction itself will be the main theme.
I expect the question of the week to be: Is the stock market correction over?
Prior Theme Recap
In my last WTWA I predicted that we would be asking whether corporate earnings strength could reverse the stock market decline. That was definitely the right question, but the answer is still in doubt. For most of the week it seemed like a resounding “No”, but buy Friday’s close losses had been trimmed. The issue remains in doubt.
Feel free to join in my exercise in thinking about the upcoming theme. We would all like to know the direction of the market in advance. Good luck with that! Second best is planning what to look for and how to react. That is the purpose of considering possible themes for the week ahead.
This Week’s Theme
Financial news is basically reactive – and usually not helpful for investors. For the first part of last week it was all about the reasons for the biggest market decline in three years. I was keeping a collection of links, but they are all very similar. Even some of the finest journalists were tasked with “reporting on the correction.” This produced disappointing stories with a laundry list of well-known problems from around the world. (For an explanation, see Josh Brown below).
There is never a discussion about which of these facts might already be reflected in market prices, nor the suggestion about the need for investors to look forward. Even the best sources cater to losing market timing.
The news flow this week will include plenty of corporate earnings reports. Once again these will be more important than the official economic data. In this context I anticipate more attention to the market rather than to the data. In particular, expect constant repetition of these questions:
Was that the bottom? Is the correction really over?
Here are some key takes on the potential for a market bottom:
Doug Short’s charts are worth more than 1000 words! Here is the story of the week. See the full post for longer term data, context and analysis of past drawdowns over the last few years.
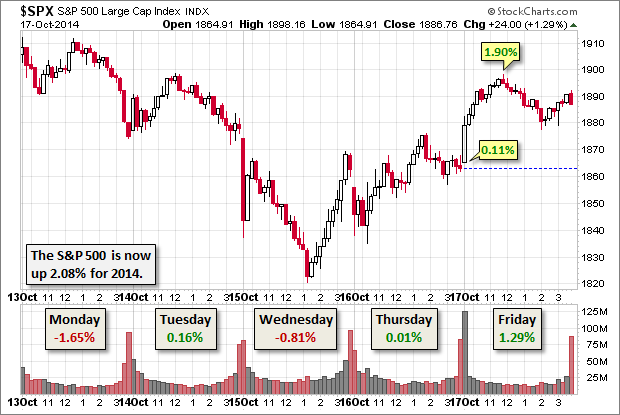
Some attribute the Wednesday rebound to comments from St. Louis Fed President Bullard that the last cut in QE3 perhaps should be delayed because of continuing low inflation expectations. Here is a blog from an anonymous twenty-something that explains this viewpoint, which is implied in some mainstream sources as well.
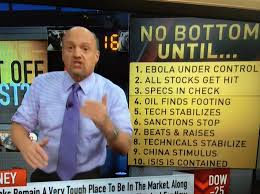
Jim Cramer shifted positions during the week. He began by unveiling a list of ten tests for finding the bottom. By Friday he concluded that there had been enough progress on each to create an “investable bottom.”
The ECRI reports that global growth is weakening and that they made this prediction in July in one of their proprietary reports.
Brian Gilmartin does not typically engage in bottom calling, but he does note the increase in forward earnings estimates, suggesting that “Wednesday’s low could be the end…of this correction.” Brian’s work is always interesting, but especially so during earnings season. He covers many specific companies, and he does it well.
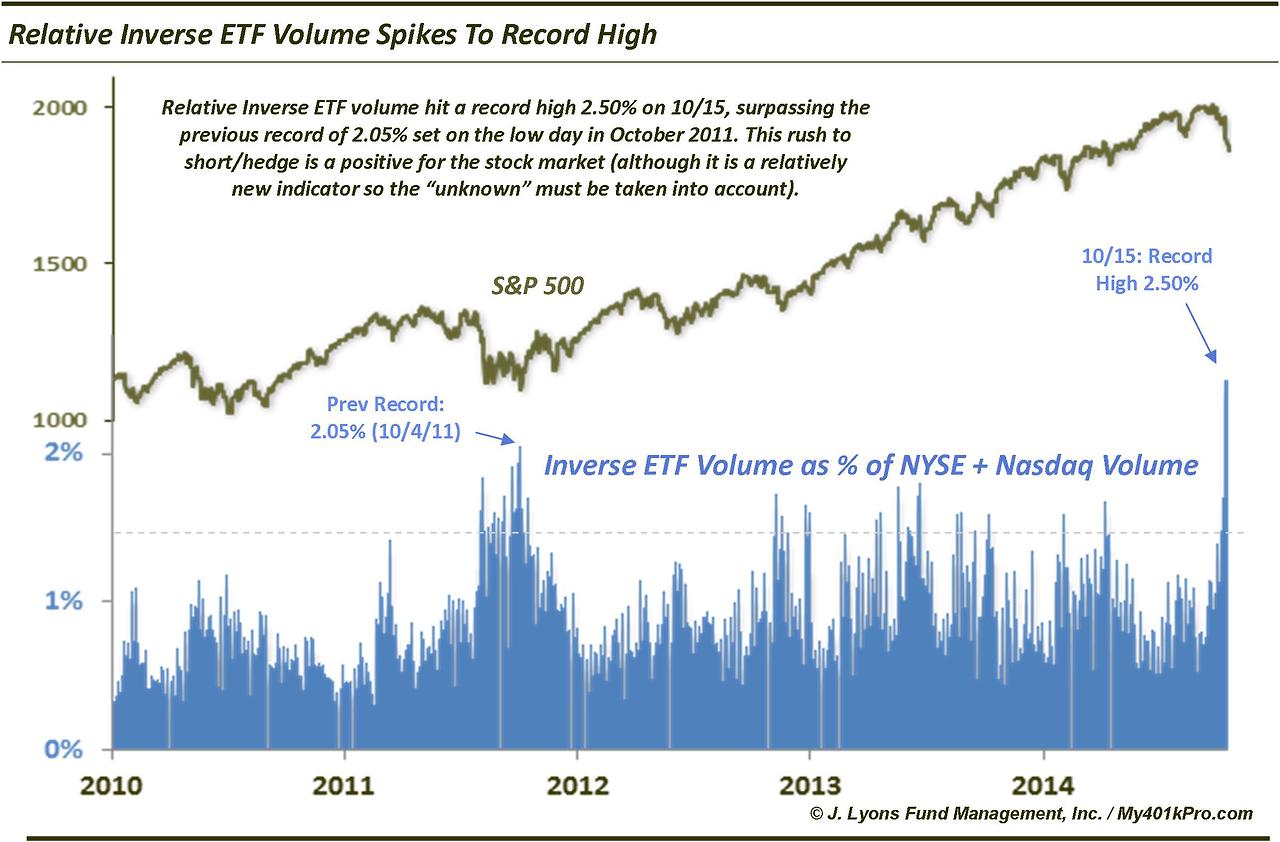
Dana Lyons notes the volume spike in inverse ETFs, but warns that it might be part of a “bottoming process.”
Josh Brown covers all of the bases with his post on “correction Twitter.” I especially like his point #4, with the laundry list of correction causes.
Before turning to my own conclusions, let us do our regular update of the last week’s news and data. Readers, especially those new to this series, will benefit from reading the background information.
Last Week’s Data
Each week I break down events into good and bad. Often there is “ugly” and on rare occasion something really good. My working definition of “good” has two components:
- The news is market-friendly. Our personal policy preferences are not relevant for this test. And especially – no politics.
- It is better than expectations.
The Good
There was not much news. The US economic picture remains solid, while China is a bit weaker and Europe at near-recession levels.
- Jobless claims remain strong. The 264,000 report was the lowest in 14 years. (Eddy Elfenbein).
- European car sales up 6.4%. (Geoffrey Smith at Fortune)
- The early earnings reports have been good. 68% have beaten on earnings and 63% on sales (FactSet’s Earnings Insight).
- Putin sees problems for the global economy if oil is $80/barrel. (Tomas Hirst at BI). Why is this good news? Unwinding the reciprocal Ukraine sanctions is the single largest current market factor. My guess is at least 10%. The first step is recognition by the participants.
- Rail traffic remains close to all-time highs. Todd Sullivan has the story. He also provides charts and analysis of other economic indicators. Good stuff.
- Plunging oil prices create stimulus. We often hear that the cure for high energy prices is high prices. The process works both ways. Citigroup estimates a $1.1 trillion stimulus impact.
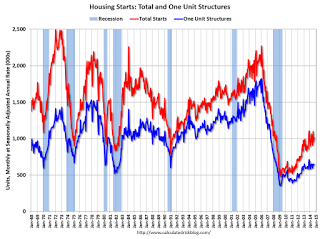
- Housing starts and building permits moved higher. Calculated Risk reports it as an ‘OK’ report. Much of the gain is still coming from multi-family construction. Here is the chart showing that comparison:
- Industrial production beat expectations. See Eddy Elfenbein for charts and analysis of the acceleration in this series.
The Bad
Most of the bad news was not about the economy. It was about the stock market reaction.
- Oil geopolitics. The story has many cross-currents, but the path to progress is challenging. Startfor (via GEI) has a great report.
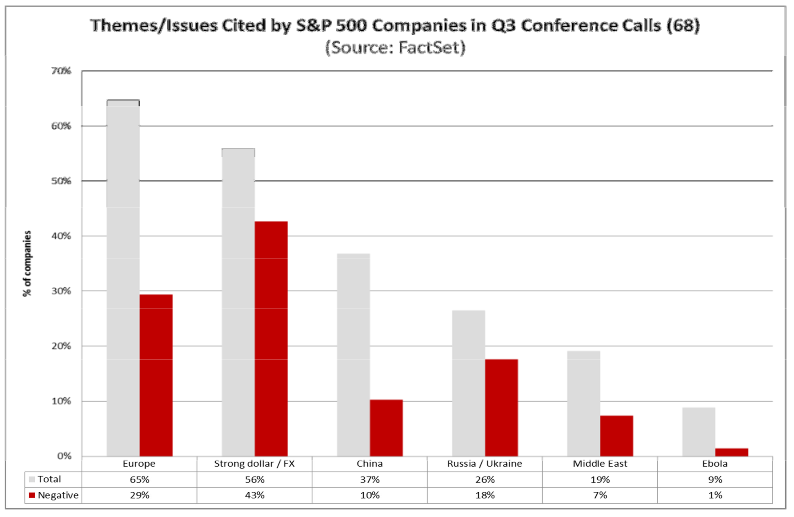
- Forward earnings guidance has been weaker. FactSet analyzed the conference calls to see what factors have been cited:
- Builder confidence decreased to 54, missing expectations of 59. Still positive, but disappointing. Calculated Risk has the complete story.
- The Beige Book showed little increase in economic growth. I always enjoy the detailed analysis from GEI.
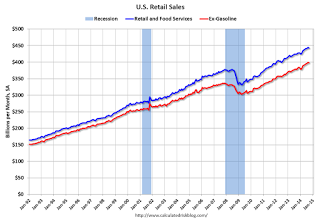
- Retail sales declined even more than expected, 0.3%, the worst economic news of the week. So far there did not seem to be a pickup from lower fuel prices. Calculated Risk has comparisons including the core and year-over-year data. Here is the long-term chart:
The Ugly
This week’s ugly news is the continuing Ebola story. The need for treatment in West Africa and international issues are now both commanding attention. It is a sad commentary that the story got traction only when there were cases in the US. I have been writing about this for months, noting that the economic effects are still relatively modest overall, but include concentrated effects in some sectors. Some astute observers (including Jim Cramer) have attributed plenty of selling to Ebola fears. One morning there was a nine-handle decline in the pre-market SPU’s (S&P futures) based on the announcement of one additional US case. I track this story closely, so I am just hitting the highlights here:
- Cuba is cooperating, sending 460 doctors to West Africa.
- It has become the biggest story on the campaign trail, with arguments rapidly falling to the lowest common denominator.
- Inside the beltway politics also looms. Health leaders disagree on how much spending commitments have affected progress toward the best treatments.
- Cam Hui provides perspective on the market effects. Hint: More modest than most think, including a provocative comparison.
- Did bureaucracy at the WHO contribute to the crisis? (Jason Gale and John Lauerman at Bloomberg).
- Ebola is even scarier than you think, according to these five myths. The “airborne” point is especially worrisome.
- Your risk is greater in driving home from the airport than flying on a plane with one of the Ebola nurses.
- Airline stocks remain under pressure. Perception is more important than reality.
The Silver Bullet
I occasionally give the Silver Bullet award to someone who takes up an unpopular or thankless cause, doing the real work to demonstrate the facts. Think of The Lone Ranger.
No award this week, although I see plenty of good candidates deserving sharp analysis and refutation.
Quant Corner
Whether a trader or an investor, you need to understand risk. I monitor many quantitative reports and highlight the best methods in this weekly update. For more information on each source, check here.
Recent Expert Commentary on Recession Odds and Market Trends
Doug Short: An update of the regular ECRI analysis with a good history, commentary, detailed analysis and charts. If you are still listening to the ECRI (three years after their recession call), you should be reading this carefully.
RecessionAlert: A variety of strong quantitative indicators for both economic and market analysis. While we feature the recession analysis, he also has a number of interesting market indicators.
Georg Vrba: has developed an array of interesting systems. Check out his site for the full story. We especially like his unemployment rate recession indicator, confirming that there is no recession signal. Georg’s BCI index also shows no recession in sight. Georg continues to develop new tools for market analysis and timing. Some investors will be interested in his recommendations for dynamic asset allocation of Vanguard funds. Georg also is working on methods to improve performance from low-volatility stocks. I am following his results and methods with great interest.
Bob Dieli does a monthly update (subscription required) after the employment report and also a monthly overview analysis. He follows many concurrent indicators to supplement our featured “C Score.”
A continuing strength of Barry Ritholtz’s blog, The Big Picture, is the embrace of a wide variety of viewpoints. This week he highlighted an article from the Cleveland Fed on labor market slack, assuring that many more people would see it. This is wonkish stuff, but very important. Labor market slack is the reason that Chair Yellen gives for relaxing the prior unemployment guideline for the start of tightening rates. If you want to forecast the Fed, you need to understand this argument. The conclusion has the normal couching of the research, but suggests that “the unemployment rate has reached its long-run level.”
The Week Ahead
We have a more normal week for economic data and events.
The “A List” includes the following:
- Initial jobless claims (Th). The best concurrent news on employment trends.
- New home sales (F). Better housing growth would be an encouraging economic sign.
- Leading indicators (Th). Despite some changes in the series, it remains a popular forecasting tool. Hale Stewart illustrates and concludes that the economy is in “decent shape.”
The “B List” includes the following:
- CPI (W). No sign of inflation so far, so interest is secondary.
- Existing home sales (T). Less direct economic relevance than new sales and construction, but still a useful indicator.
- Chinese economic data (T). This includes GDP, industrial production, and retail sales.
The speech calendar is greatly reduced in front of the upcoming FOMC meeting.
The big stories of the week should come from corporate earnings announcements.
How to Use the Weekly Data Updates
In the WTWA series I try to share what I am thinking as I prepare for the coming week. I write each post as if I were speaking directly to one of my clients. Each client is different, so I have five different programs ranging from very conservative bond ladders to very aggressive trading programs. It is not a “one size fits all” approach.
To get the maximum benefit from my updates you need to have a self-assessment of your objectives. Are you most interested in preserving wealth? Or like most of us, do you still need to create wealth? How much risk is right for your temperament and circumstances?
My weekly insights often suggest a different course of action depending upon your objectives and time frames. They also accurately describe what I am doing in the programs I manage.
Insight for Traders
Felix has continued the bearish call initiated three weeks ago. Most sectors have a negative rating and the broad market ETFs are all negative. The Felix trading accounts were completely invested inverse ETFs and some Latin American ETFs. Since Felix uses a three-week time horizon, the recent move has been timely. Felix does not anticipate tops and bottoms, but waits for evidence of a change.
90% of British retail forex traders lost money. This is in line with most results I see, despite the advertisements that make it all seem so busy. You really need to have a well-tested system if you intend to do short-term trading.
You can sign up for Felix’s weekly ratings updates via email to etf at newarc dot com.
Insight for Investors
I review the themes here each week and refresh when needed. For investors, as we would expect, the key ideas may stay on the list longer than the updates for traders. The recent “actionable investment advice” is summarized here.
Whenever there is a market decline, we are bombarded with “explanations” and predictions of disaster. To keep perspective I wrote a section last week covering these three points:
- What is not happening;
- Factors most often linked to major market moves; and
- The best strategy for the current market.
If you missed this section last week, I urge you to check out the Investor Section of last week’s WTWA.
I also wrote a section about value investing last week.
If you are a value investor, it is up to you to determine what your investments are worth. If your methods are sound and the market disagrees, then you can use volatility to add more to your most attractive holdings. If you have made a mistake in your choices, you need to re-evaluate and move on. Price is what you pay; value is what you get.
I decided that I could make this point better and with a little humor in Why Investors Must Understand Value (with an apology to Mr. Buffett).
We continue to use market volatility to pick up stocks on our shopping list. We do this because we also sell positions when they reach our (constantly updated) price targets. Being a long-term investor does not require you to “buy and hold.” Taking advantage of what the market is giving you is always a good strategy.
Other Advice
Here is our collection of great investor advice for this week:
Please read and enjoy the piece from Henry Blodget at Business Insider on 16 meaningless phrases that will make you seem smart on CNBC. This is one of the reasons that we use TIVO and mute while watching! If you are a regular viewer of financial TV, you will recognize all of these. The “easy money has been made” is a good example. Henry says that it implies “wise, prudent caution and that you bought or recommended the stock a long time ago.” You can waffle between further upside and the potential for risk. The other fifteen are nearly as good.
Ignoring the commentary noise is also a theme from Carl Richards at the NYT. See the great sketch! He quotes one of our favorites, Art Cashin, who accurately reflects the pulse of the market:
Of course, it’s led to some entertaining headlines and predictions. I think my favorite might be from the veteran trader Art Cashin, who told CNBC last week that “the S&P 500 index needs to stay above the 1,950 level to avoid further declines.”
After hearing that comment, a friend sent me his own explanation. Unless the market doesn’t go down, it will go down. If it stays up, it will not have gone down. Unless it goes down later, which will only happen if it doesn’t stay up.
Such precise predictions are a part of the noisy industry of forecasters and gurus that’s grown up around investing. Sometimes, they get it right, at least temporarily. The S&P 500 did indeed fall below 1,950 and is around 1,900 as of this writing. But it would only need a 3 percent gain to be back above that level again, which could happen in just a couple of days.
David Rosenberg (via Business Insider) has earned respect through willingness to change his opinions along with the evidence. His Tuesday note described a problem in market-timing, an excessive focus on the trees rather than the forest.
Prof. Robert Shiller’s CAPE ratio is the foundation of many bearish arguments. Jason Zweig eschews the usual media approach of trying to coax him to predict a crash. Instead, he produces a balanced explanation of how Shiller uses his own method. For his own portfolio he is still 50% in stocks, something I have frequently reported before. He does not find current readings to be extreme, and even muses about whether something might have changed. He likes health care and industrials.
25iq covers a dozen lessons learned from Guy Spier. It is a great read with good sources. Here is one example:
1.”The entire pursuit of value investing requires you to see where the crowd is wrong so that you can profit from their misperceptions.” A value investor seeks to find a significant gap between the expectations of the market (price) and what is likely to occur (value). To find that gap the value investor must find instances where the crowd is wrong. Michael Mauboussin writes: “the ability to properly read market expectations and anticipate expectations revisions is the springboard for superior returns – long-term returns above an appropriate benchmark. Stock prices express the collective expectations of investors, and changes in these expectations determine your investment success.”
Value investing is buying assets for substantially less than they are worth and, says Seth Klarman “holding them until more of their value is realized.” Klarman describes the value investing process as “buy at a bargain and wait.” It is critical that the value investor not try to time the market but rather make the market their servant. The market will inevitably give the gift of profit to the value investor, but the specific timing is unknowable in advance. If there is a single reason people do not “get” value investing it is this point. The idea of giving up on trying to time the market is just too hard for some people to conceive. For these people, timing markets is a hammer and everything looks like a nail. That you can determine an asset is mispriced now relative to intrinsic value does not mean you can time when the asset will rise to a price that is at or above its intrinsic value. So value investors wait, rather than try to time markets.
Here are the fifteen most-hated stocks based upon short interest. (Philip Van Doorn at MarketWatch) I am not recommending short selling, but you might want to do some extra research if you own any of these.
And here are some stock ideas from Ben Levisohn at Barron’s, who notes that the selling has been indiscriminate.
If you are stuck in gold, you might consult us about our gold bug methadone treatment. If you are out of the market completely, you might want to reconsider your approach. The current economic cycle is in the fifth inning. This is one of the problems where we can help. It is possible to get reasonable returns while controlling risk. You can get our report package with a simple email request to main at newarc dot com. Also check out our recent recommendations in our new investor resource page — a starting point for the long-term investor. (Comments and suggestions welcome. I am trying to be helpful and I love and use feedback).
Final Thought
I do not have a short-term market call. For the longer term, the headline risk is well-known and the potential for solutions are not newsworthy. This provides opportunity.
In WTWA I often share conclusions in an effort to be timely. Some of these eventually get a separate article and other spark a useful discussion in the comments. In that spirit, here are a few thoughts from last week:
- I am amazed by Cramer’s list of problems. When he first produced it (Monday), I suggested to our team that these things were far from solution. By Friday it had all changed. I also dislike the combination of market data and fundamentals. People need to decide whether to trade or to invest.
- Early week selling did not relate to data, despite the popular stories. No one cares about the Empire Index and a lower PPI is basically good. If you just looked at the retail sales data, the worst news of the week, you would find it disappointing, but not a disaster. It would be amusing to tell a group of “experts” in advance what the data will be for the day or the week and then let them guess the market result.
- The Schlumberger (NYSE:SLB) conference call (transcript helpfully available on Seeking Alpha, a great resource for those watching earnings) provided helpful fresh information on global energy supply and demand providing an upbeat forecast. The selling in energy stocks has been indiscriminate, even though some (refiners?) may benefit from lower prices.
- General Electric's (NYSE:GE) report also showed strength in several relevant sectors. These are not “one-off” companies, so I am paying some attention.
- And finally, it is a continuing mistake to interpret every market move in terms of the Fed. The remaining QE is small. The exact timing of the end is of little consequence. Do not expect any more QE. The key Fed policy is the pace of interest rate increases and forward guidance. Whether the market likes it or not, that will remain “data dependent.”

