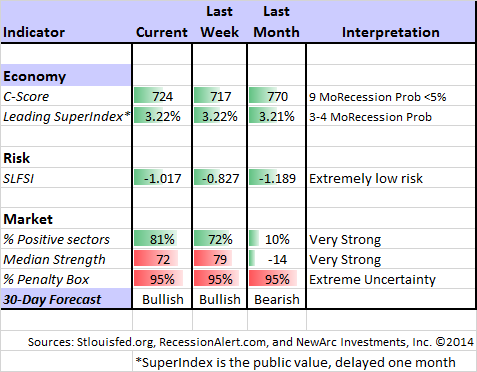
We have a jam-packed week of earnings data, important economic news, and the mid-term elections. Surely one of these topics should be the market theme for the upcoming week.
But old habits die hard. I expect the mainstream media to parse everything through the prism of the Fed – at least for another week or so. Each new piece of data will raise the question:
What is the message for investors in the post-QE world?
Prior Theme Recap
In my last WTWA (two weeks ago) I predicted that we would be asking whether the market correction was over. Continuing my hot streak of guessing the upcoming issue, that was definitely the right question. I did not have a strong personal answer, but there were both winners and losers among those cited.
Had I been able to write last weekend, I am not sure that I would have been as successful with the theme of the week. I always plan for the week ahead, but I cannot always write about it. There were plenty of moving parts last week!
Feel free to join in my exercise in thinking about the upcoming theme. We would all like to know the direction of the market in advance. Good luck with that! Second best is planning what to look for and how to react. That is the purpose of considering possible themes for the week ahead.
This Week’s Theme
In general, the week of the employment report provides an easy guess about what will dominate the news. This week we also have the mid-term elections and plenty of earnings news. Normally one of those would be the theme, but I am going out on a limb. I expect all to get some play, but the media focus remains on the “old news” of the Fed and the decision to end QE. For several years the interpretation of news has been easy: What does “X” mean for Fed policy? It will take time to make a transition.
We have lived through an era where both good and bad economic news were modified by the concept that the Fed would react in the opposite direction. Have we finally reached a time when good news will be good?
I expect at least one more week of Fed fixation. Each event will raise the question: What does the end of QE mean for the individual investor?
There are several viewpoints:
- The QE Diehards will not let go. They subscribe to a mindset where the Fed does not have a dual mandate, but a single-minded pursuit of supporting stock prices. This is true no matter which party controls the White House or the Congress, and regardless of the political affiliation of the Fed Chair. These sources expect a new round of QE if and when stock prices decline.
- The end of QE will lead to an imminent stock market collapse. Chief proponents cited the comments from St. Louis Fed President Bullard as responsible for turning the decline in stock prices. They stuck to that story no matter what else happened.
- QE policy had only a small effect on the economy.
- QE has not changed that much. The most important impacts come not from ongoing purchases but from the continuing size of the balance sheet. Bill McBride displays a sophisticated understanding of this point, and he explains it well.
Before turning to my own conclusions, let us do our regular update of the last week’s news and data. Readers, especially those new to this series, will benefit from reading the background information.
Last Week’s Data
Each week I break down events into good and bad. Often there is “ugly” and on rare occasion something really good. My working definition of “good” has two components:
- The news is market-friendly. Our personal policy preferences are not relevant for this test. And especially – no politics.
- It is better than expectations.
The Good
There was not much news and it was mostly good.
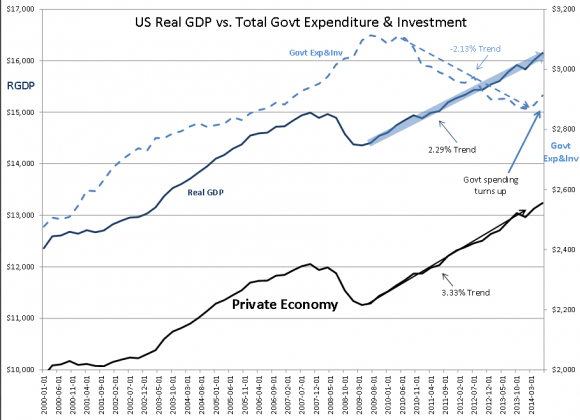
- Q3 GDP beat expectations with a gain of 3.5%. At first blush this is great news (Wonkblog has details). Several sources correctly noted that some of the surprise gains came from defense spending and exports. This is true. It is also true that government spending, especially at the state and local level, has been a continuing big drag. I really do understand the need for commentators with a political viewpoint to speak out, especially right before an election. I only wish that investors were better at tuning out these arguments. Please see “The Ugly” for more discussion. Todd Sullivan posts the savvy “Davidson” who explains how this all fits, including this chart:
- The BOJ adds stimulus – big time. Reuters has a solid factual account.
- Falling VIX represents a good sign, at least for the next six weeks. Jim Strugger at Barron’s sees a possible breakout to new all-time highs.
- Gas prices are falling. This implies $720/year for the average consumer (via Jeffry Bartash).
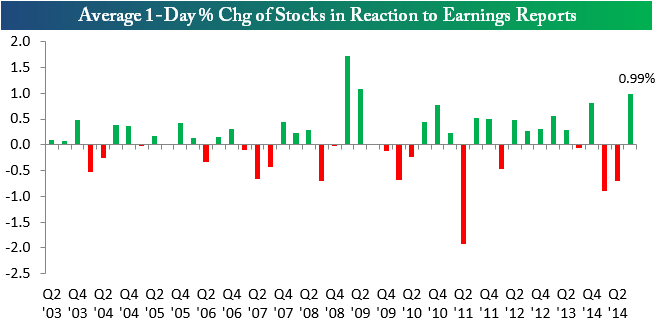
- Stock reaction to earnings has been positive. The beat rate continues and the stock response has been surprisingly positive. Bespoke has the story and this chart:
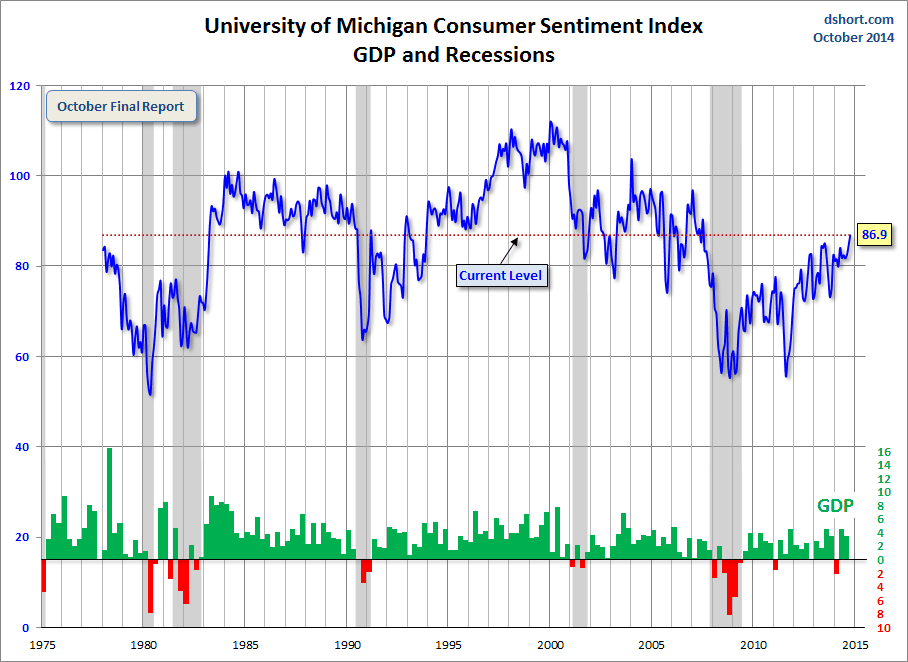
- Consumer confidence hit the highest levels since 2007. Doug Short covers both the Conference Board and University of Michigan versions.
The Bad
There was not very much bad news. Readers are invited to nominate ideas in the comments, but remember that we are focusing on recent developments, not a list of continuing macro concerns.
- Durable goods orders disappointed. Internal data were also disappointing. See the full analysis from Steven Hansen at GEI.
- Forward earnings estimates decline further. Brian Gilmartin notes the decline from growth of 9.11% to 7.87%. The earnings yield remains attractive.
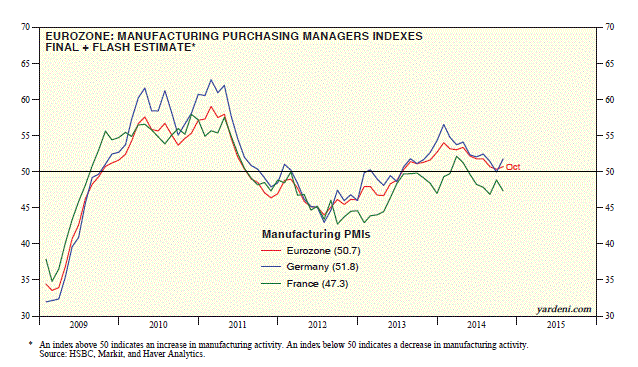
- European stress tests fail 25 out of 130 banks. (Details from Quartz). See Jonathan Buck for the bright side of this story – improvement. Ed Yardeni notes the overall weakness in Europe as measured by PMIs:
- The drought continues. The states that are hurting the worst have the greatest water consumption. This story deserves monitoring, and GEI has a good update.
The Ugly
Negative campaigning. With only a few days of attack ads left before the election, most people profess to hate the negative ads. Campaigns continue to use them because they are effective, especially with late-deciding fence sitters.
At another time the US congressional election might be an important market story. This time is different:
- Voters are unhappy about the economy and show a preference for Republican economic policies (The Hill).
- Anxiety reigns. William Galston expertly analyzes a host of non-economic issues (Politico).
- Nate Silver’s respected 538 gives the GOP a 201 chance of taking control of the Senate as well as padding their advantage in the House.
- The policy impact will be small, since we have already been dealing with gridlock. Those who want to see no new policies may celebrate. Those who think action is needed can wait for two more years.
The drumbeat of negativity affects your investing. Matt Phillips explains nicely how the overall economy is strong, yet many are not participating. We cannot help others with our investment accounts; we can only make the best choices given the economic reality. He includes a good summary of important economic indicators.
Ebola fear is another good example. Check out this “crash course” on how Ebola pushes every fear button in our instincts, generating emotional reactions.
The Silver Bullet
I occasionally give the Silver Bullet award to someone who takes up an unpopular or thankless cause, doing the real work to demonstrate the facts. Think of The Lone Ranger.
Americans will believe anything if you provide a chart – a new scientific study reported in Businessweek. I was bombarded with “scary” chart packages for Halloween. Few sources seem to be doing the hard and thankless work of fighting this stuff. Not enough page views.
Quant Corner
Whether a trader or an investor, you need to understand risk. I monitor many quantitative reports and highlight the best methods in this weekly update. For more information on each source, check here.
Recent Expert Commentary on Recession Odds and Market Trends
Doug Short: An update of the regular ECRI analysis with a good history, commentary, detailed analysis and charts. If you are still listening to the ECRI (three years after their recession call), you should be reading this carefully.
RecessionAlert: A variety of strong quantitative indicators for both economic and market analysis. While we feature the recession analysis, Dwaine also has a number of interesting market indicators.
Georg Vrba: has developed an array of interesting systems. Check out his site for the full story. We especially like his unemployment rate recession indicator, confirming that there is no recession signal. Georg’s BCI index also shows no recession in sight. Georg continues to develop new tools for market analysis and timing. Some investors will be interested in his recommendations for dynamic asset allocation of Vanguard funds. Georg has a new method for TIAA-CREF asset allocation. I am following his results and methods with great interest.
Bob Dieli does a monthly update (subscription required) after the employment report and also a monthly overview analysis. He follows many concurrent indicators to supplement our featured “C Score.”
David Rosenberg does not see a recession until at least 2016. His reasoning is similar to what I have cited here for several years.
The Week Ahead
We have a big week for economic data.
The “A List” includes the following:
- Employment report (F). Always a complex story, with maximal spin potential.
- ISM Index (M). Good concurrent read on the manufacturing economy with some leading characteristics.
- Initial jobless claims (Th). The best concurrent news on employment trends.
- Auto sales (M). Independent read on the economy for those who like to see some non-government data.
The “B List” includes the following:
- ISM services index. (W). Services make up the larger portion of the economy, but the series has less history the manufacturing counterpart.
- ADP private employment (W). Valuable alternative measure of employment growth.
- Trade balance (T). September data will impact final Q3 GDP.
- Construction spending (M). September data. Interesting, but a volatile series.
- Factory orders (T). Another volatile series from September.
Tuesday’s mid-term Congressional election is likely to shift power to Republicans, but unlikely to have a significant market impact. Other big stories of the week might come from corporate earnings announcements.
How to Use the Weekly Data Updates
In the WTWA series I try to share what I am thinking as I prepare for the coming week. I write each post as if I were speaking directly to one of my clients. Each client is different, so I have five different programs ranging from very conservative bond ladders to very aggressive trading programs. It is not a “one size fits all” approach.
To get the maximum benefit from my updates you need to have a self-assessment of your objectives. Are you most interested in preserving wealth? Or like most of us, do you still need to create wealth? How much risk is right for your temperament and circumstances?
My weekly insights often suggest a different course of action depending upon your objectives and time frames. They also accurately describe what I am doing in the programs I manage.
Insight for Traders
Felix made a quick shift from bearish to bullish. There is excellent breadth among the strongest sectors and very high ratings. Felix does not anticipate tops and bottoms, responds pretty quickly when there is evidence of a change. The penalty box can be triggered by extremely high volatility and volume. It is similar to a trading stop, but not based only on price. This came into play two weeks ago when we moved to partial long positions. Last week the trading accounts were back to fully invested.
Dr. Brett has a great post on price-based stop losses and the advantages of using a catastrophic risk method instead.
You can sign up for Felix’s weekly ratings updates via email to etf at newarc dot com. Felix also makes a daily afternoon appearance at Scutify.
Insight for Investors
I review the themes here each week and refresh when needed. For investors, as we would expect, the key ideas may stay on the list longer than the updates for traders. The recent “actionable investment advice” is summarized here.
Whenever there is a market decline, we are bombarded with “explanations” and predictions of disaster. To keep perspective I wrote a section last week covering these three points:
- What is not happening;
- Factors most often linked to major market moves; and
- The best strategy for the current market.
If you missed this section from a few weeks ago, I urge you to check out the Investor Section of the earlier WTWA.
Some readers commented about the last WTWA installment, saying that I seemed to be disagreeing with Felix about how October would play out. I was recommended, as I have throughout the year, that investors should use market volatility to trim positions that hit price targets and add new stocks on dips. This was not intended as a short-term prediction for October, but practical advice for investors.
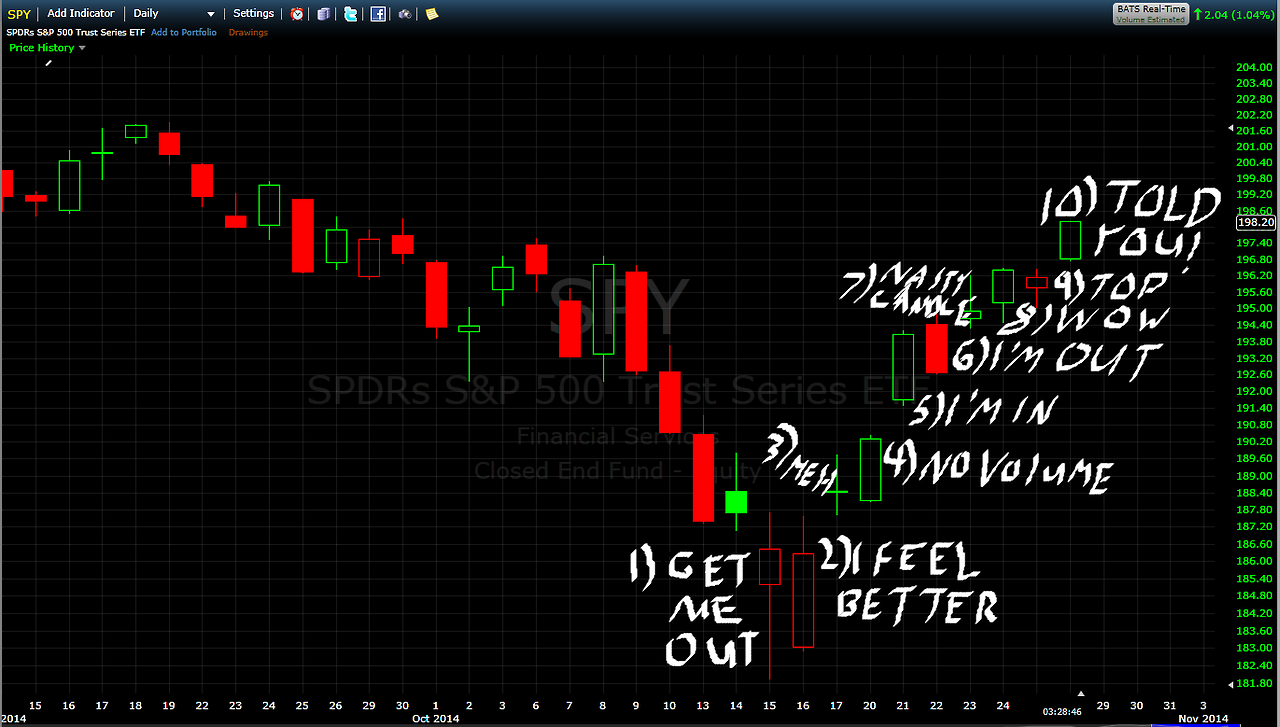
Most investors who try to time the market by anticipating corrections fail to move quickly to get back in. The result is that they miss some really big moves. If you have a disciplined trading approach (like Felix) it is easier to accept that a trade is not working and reverse course.
Michael Batnick has a day-by-day account of the thinking of an average investor trying to time the decline. To appreciate fully, you need to read the entire log!
Taking advantage of what the market is giving you is always a good strategy.
Other Advice
Here is our collection of great investor advice for this week:
Alan Steel has five simple but powerful words from Humphrey Neill’s 1954 book, two of his ten tips to guarantee failure:
1) Follow the Public
2) Be Impatient
Only five words but better than any book on investing.
Did you know that on October 16th 2014 in the US Stockmarket, the volume of share dumping exceeded ALL THE DAYS in the last 850 Days? IN ONE DAY!
Read the entire post for the full story.
And now the individual investor may be returning. Josh Brown, in his maiden column for Fortune, explains. Regular readers know that I regard Josh as one of the best and most important voices helping the individual investor. In our office we accord him our highest honor – we take CNBC off mute and turn the TIVO back to listen! We wish him a wide and well-deserved readership.
Stock suggestions from a Barron’s investor conference. Sources like this provide ideas that you probably would not find from your own screening method, although I do have some of the themes.
Quit grumbling that the playing field is not level. Kid Dynamite explains that you could pay for premium data access and it still would not make any difference.
Time to add to commodities? Barron’s evaluates this contrarian play.
Goldman Sachs recommends “cyclical laggards.” I do, too.
Market timing does not work. Two more evidence-based entries on this continuing theme:
- The multiple errors of Dennis Gartman, whose regular appearances on CNBC do not provide information about the overall record.
- Professional timer observer Mark Hulbert provides the discouraging results. A few of the pros showed a small advantage, but no one succeeded at calling tops and bottoms.
- Alan Steel, quoting some good sources, passes along this summary:
“It was just a few weeks ago that all was right in the world…except Syria, ISIS, Iraq, terrorism, Greece, Portugal, Brazil, Ukraine, Russia and QE ending…
“And then along came Ebola; all 8 cases, in the US, and the unfortunate death of one of those ill.
“What has been the price for that revolutionary new fear, against the backdrop of the previous myriad of items on the “crisis list?”
“A few trillion dollars in world-wise stock market corrections.
“But what happened?
“Well, with the exception of a few minor differences in scope, you and I could have slept through this “terrible October” and been none the worse.
Pulling this all together, Abnormal Returns explains what the individual investor should do – create a personal margin of safety. Tadas uses his broad knowledge and experience to pull together advice from several leading sources. If you had followed this approach over the last few years, you would have been able to stick with your program during the tough times. It will be of equal help in the future.
If you are stuck in gold, you might consult us about some good alternatives. If you are out of the market completely, you might want to reconsider your approach. The current economic cycle is in the fifth inning. This is one of the problems where we can help. It is possible to get reasonable returns while controlling risk. You can get our report package with a simple email request to main at newarc dot com. Also check out our recent recommendations in our new investor resource page — a starting point for the long-term investor. (Comments and suggestions welcome. I am trying to be helpful and I love and use feedback).
Final Thought
The change in Fed policy is unimportant. It was a major story because it was the technical end of the program. For those who have been monitoring the actual policy, what has changed? The bond purchases had already been tapered to $15 billion per month from the former $85 billion. The timing was known. There was no surprise.
I am amazed that anyone attributed a 10% rebound from the bottom to a vague comment about QE4 from Bullard, a non-voting member. This is a perfect example of how people force evidence into a pre-conceived theory. How do these observers explain the continuing rally after QE4 was rejected?
There is a very sharp difference between two viewpoints, both of which I have highlighted in the past.
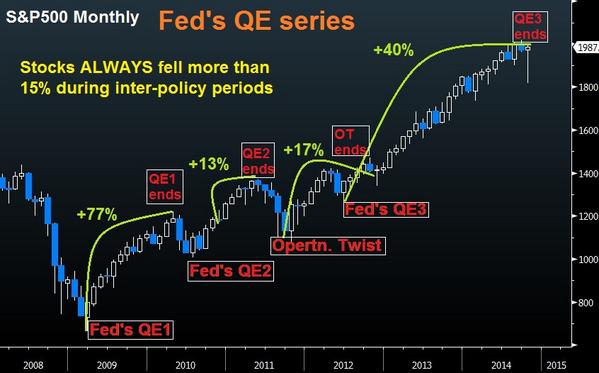
One group ignores changes in economic growth, geopolitical risks, and corporate earnings, attributing the entire stock market rise to QE. Here is a typical example, posted by a professional bubble-caller:
I really like the “ALWAYS” as a description of two occasions!
A Stronger Viewpoint – the Chart
I really wish that someone would earn a Silver Bullet by analyzing the myriad versions of the QE chart. Here is some help to get going. When a policy changes (and this is stuff I taught in class decades ago) you can choose several different candidates as the starting point:
- When the idea surfaces
- When the idea gains credence
- When there is the hint of a serious proposal
- When the policy is adopted
- When the policy is implemented
If you want to do a serious analysis you must use the same definition for each point. You cannot use the “Labor Day Jackson Hold hint” for one starting point and then wait until the last gasp of QE3 for another. I hope that this is blindingly obvious. Those who violate these rules simply look for big sweeps of stock market changes and adjust the starting and ending points to fit. They can cite impressive “sources” since the underlying data are accurate. The flaw is implementation of the chart, not raw data.
The pieces fit, but the conclusion is deceptive. There has been a long period of economic growth, probably helped a little by QE, but we will never know for sure. On two occasions the growth faltered, and the Fed expanded policy. There is little inference to draw from the two pauses in policy.
A Stronger Viewpoint – the Policy
Could this happen again? Perhaps, but it is very unlikely. If the current economic recovery, which seems much stronger than that at the end of the prior two QE periods, should falter the Fed will face a choice. The current mood is to focus on forward guidance rather than QE.
Bob McTeer explains the skepticism among Texans, especially about money printing. As you read his take, remember that he is a level-headed conservative.
We will gradually learn to focus less on the Fed and more on the data. Until that happens, investors will continue to enjoy opportunities.
More sophisticated analysts understand that Fed policy has changed only slightly. The most important effects come not from the continuing purchases but the size of the balance sheet. Justin Wolfers provides a great explanation with this conclusion:
But for all the hubbub about the decision to end quantitative easing, realize that the degree of monetary support the economy is receiving tomorrow will be no smaller than it was receiving yesterday.
If you do not understand this, imagine that there is a poker game and we are trying to spot the least knowledgeable player…..

