The USD and Asia stocks were generally stronger as most of the region returned from holidays today.
Good afternoon from Singapore and a Happy New Year to all our readers. A new year equals a new budget it seems and even with Tokyo on holiday today traders wasted no time in loading up on USD in the early hours of the twilight zone this morning. In particular, against the majors and although some of those gains have been given back the USD is broadly stronger against JPY, GBP and EUR on the day.
Stocks were broadly in the green with Australia and Hong Kong the standouts following a sparkling China PMI this morning. This also took the wind out of USD’s sails.
Looking around the markets today in Asia,
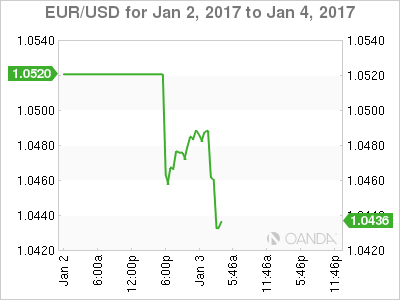
Gapped lower on the Sydney open, commencing trading around the 1.0480/90 level from a 1.0520 previous close. We traded down to around 1.0455 before some profit taking set in as Asia arrived. Nevertheless, EUR/USD is still weaker by about 35 points on the day. Support lies at 1.0455 and then 1.0400 with resistance at 1.0525 on the charts and then 1.0660, last week’s “flash rally” high.
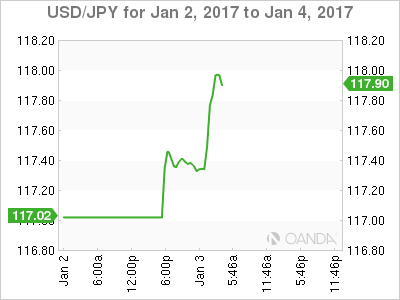
With Tokyo on holiday today trading volumes were very much thinned. It did, however, jump to 104.53 on the open from a close at 117.05 last week. Some profit taking immediately set in as per the Euro and it settled around 117.35/40 still 40 points higher on the day. Resistance is at 117.55 and 118.00 on the hourly charts with support at 117.30/35 and then 117.00.
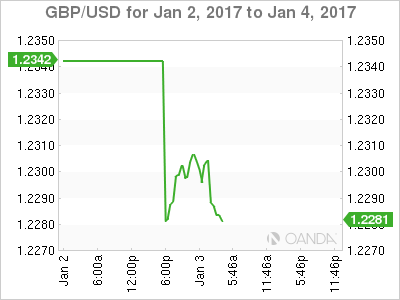
Much the same story, gapping from a New York close at 1.2340 down to 1.2295 in the first hour before gradually grinding higher as Asia arrived. it settled around the 1.2300 level for the remainder of the session. The days low at 1.2275 is first support with resistance at 1.2310 and then 1.2350.
The Australasians bucked the trend moving higher after the China PMI.
09:45 *(CN) CHINA DEC CAIXIN MANUFACTURING PMI: 51.9 V 50.9E; 6th consecutive expansion; highest print since Jan 2013 – Source TradeTheNews.com
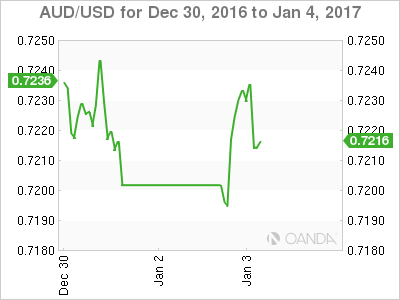
After being marked down as per the majors above, AUD got an immediate and rapid lift from the PMI. AUD rallied from a 7195 low past its New York close and onto a 7235 high. The hourly chart shows some good resistance at 7245 and a triple bottom for support at 7190.
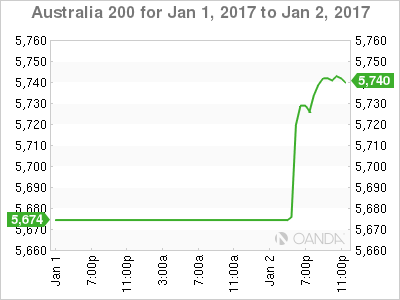
Where goes China goes Australia has been the mantra of choice for many a year in the investment community. A very good Manufacturing PMI in China equals more things being dug out of the ground in Australia to sell to them. The ASX liked what it saw, climbing 1.2% to be the best performing market on the day.
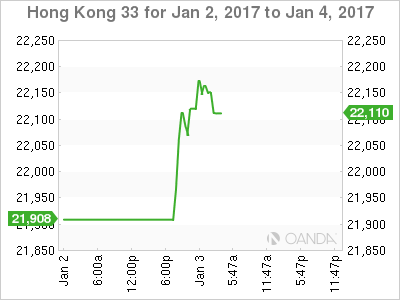
Another high beta index to China for obvious reasons. It to shrugged off news of China tightening currency outflows further and moved higher by 1.10 % post-PMI.
It wasn’t all PMI’s in China today. CFETS announced additional currencies into its CNY index basket as of yesterday. More information here. CFETS change source: Reuters
Net net, although the USD percentage dropped, the addition of Saudi Riyals and UAE Dhirams modifies the effect. Along with HKD, all are pegged to the mighty USD, making the basket more trade reflective, but a zero sum game. A number of additional emerging currencies such as ZAR were added making the basket more vulnerable to devaluation shocks going forward.
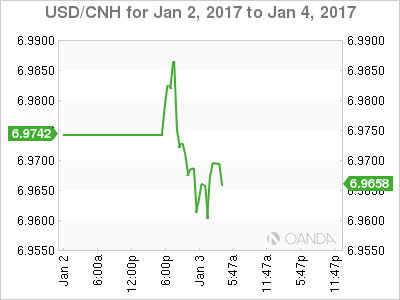
USD/CNH moved higher to 6.9875 before a stronger then expected CNY fix at 6.9498 and then the PMI gave the CNH a lift. It moved aggressively down to 6.9605 where it sits now.
CNH funding is also playing its part, squeezing higher again making short CNH expensive.
HONG KONG’S OVERNIGHT YUAN BORROWING RATE FIXED AT 17.7584 PCT, HIGHEST SINCE SEPT 19 source Reuters
