All of the focus this morning will be on the Nonfarm Payroll report. It will show more jobs added, maybe a downtick in the unemployment rate and perhaps a small change in hourly earnings. Plotted on a chart, today’s report added to all the other monthly reports that will not be discernible. Yet there will be a thousand opinions on how you should interpret it, and how the Federal Reserve will interpret it. My advice? Ignore all except the actual statistics that will likely indicate continued growth in the economy. Then get back to following price action.
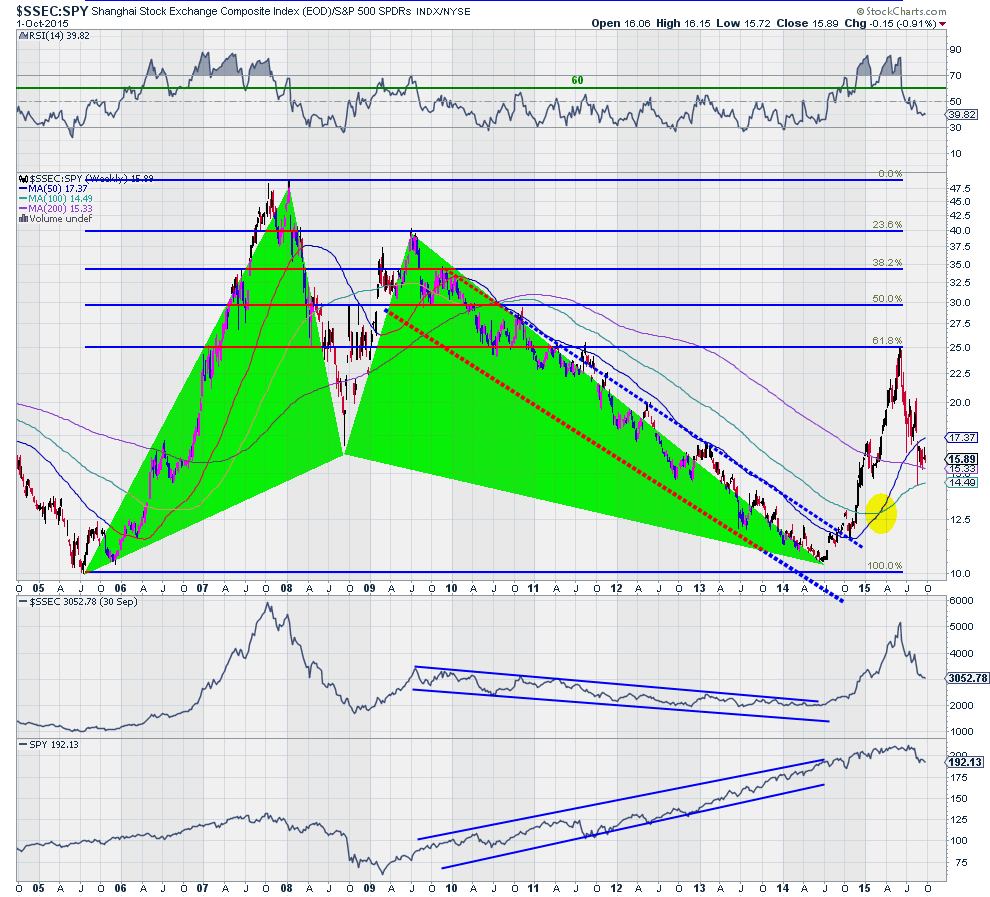
One place to look if you are interested in the long-term is the relationship between the Chinese and US markets. The chart below shows the that relationship over the past 11 years. A lot of up and down.

The two green triangles represent a harmonic pattern, a Bat to be specific. This was a bullish Bat as it looked for a reversal higher off of the 2014 low and a 38.2% retracement of the pattern. It would have looked for it sooner but it did finally happen, and look where that peak is, right at 38.2%.
Since then the pullback in the ratio has settled at an interesting level. On top of the long run 200-month SMA, and bouncing off of the 50-month SMA. The Golden Cross (highlighted) looks to have played out in the short run and a retest is occurring. As that happens the momentum indicator RSI is leveling as it reaches into the bearish range.
Which way will it go from here? The components suggest that it depends on the Chinese market. But if the US market does continue lower quickly that could play a bullish role in this indicator. A move back above the June peak would create a new harmonic pattern. Keep watching.
The information in this blog post represents my own opinions and does not contain a recommendation for any particular security or investment. I or my affiliates may hold positions or other interests in securities mentioned in the Blog, please see my Disclaimer page for my full disclaimer.
