Starting in late February I began to see some warning signs for the short-term movement in U.S. equities. On Feb. 23rd I wrote in my Technical Market Outlook:
While I think the current trend looks health the short-term price action appears to be stretched at the moment. Volatility (VIX) momentum has been pushed down quite a bit. I wouldn’t be surprised if we see some bumps in the near future that could push the VIX higher. We’ll see.”
I also began tweeting some of the intraday/bearish charts I was seeing (here, here, and here). While the long-term price action in the S&P 500 still appears healthy (you can read more on this in the above mentioned Technical Market Outlook link) I still like to pay attention to the short-term price action as well.
Since then, volatility has risen about 20% and the S&P 500 has dropped a couple of percent, nothing major. But with this small period of weakness I want to show the U.S. equity chart I’m keeping an eye on that moves beyond just the intraday swings of the market.
Price
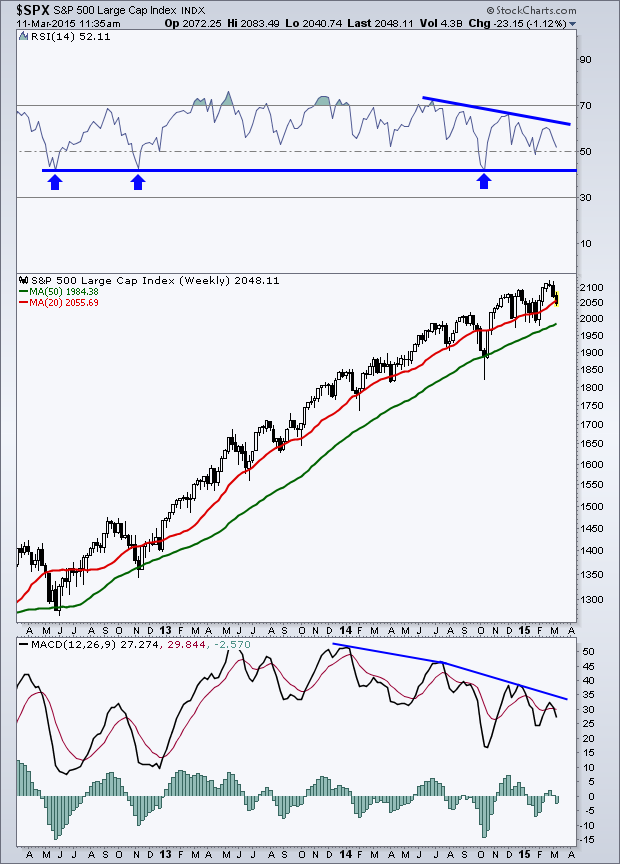
Below is a weekly chart of the S&P 500 (SPX) going back to early 2012. Along with the SPX I’ve included the 20-week (same as the often discussed 100-day) and the 50-week Moving Average. These Moving Averages have acted as support during prior dips in equities for the current up trend. As of the time of this writing, we are testing the 20-week right now. As price continues to make higher highs and higher lows, from a price action perspective things look fine and the trend is clearly up.
Momentum
Moving to momentum, I’ve included the Relative Strength Index (RSI) and the MACD indicators. Since 2012, the RSI has been in a bullish range as it moves from 40 to over 70. This is a good sign that buyers continue to move in and has helped define the ‘buyable dip’ theme that’s been taking place over the last several years. However, most recently, a bearish divergence has developed in both the RSI and the MACD momentum indicators. As price has trekked higher, momentum has begun making lower highs, which has typically preceded turning points.
If we do continue to see price move lower, taking the RSI and MACD with it, I’ll be watching to see if prior support in the Relative Strength Index is able to hold up and provide some relief for equity bulls. I will also be keeping a close eye on these longer-term Moving Averages (20- and 50-week) and see how price responds if (in the case of the 50-week) they do get tested.
In the meantime, I’ll respect the current up trend and the notion that breadth (not shown) has continued to confirm the the new highs in price which in my opinion should not be disregarded. But these are the levels I’m watching, we’ll see where price takes us.

Disclaimer: Do not construe anything written in this post or this blog in its entirety as a recommendation, research, or an offer to buy or sell any securities. Everything in this post is meant for educational and entertainment purposes only. I or my affiliates may hold positions in securities mentioned in the blog. Please see my Disclosure page for full disclaimer.
