In my last post, I wrote about the small solace I took in profits on my short AUD/JPY position as the Japanese yen (via Guggenheim CurrencyShares Japanese Yen (NYSE:FXY)) surged in response to a looming victory by Donald Trump for the U.S. Presidency. At the time, I closed out the position assuming that currency bearishness was over-extended by quick-trigger negative sentiment. The trade was timely as AUD/JPY soared soon after.
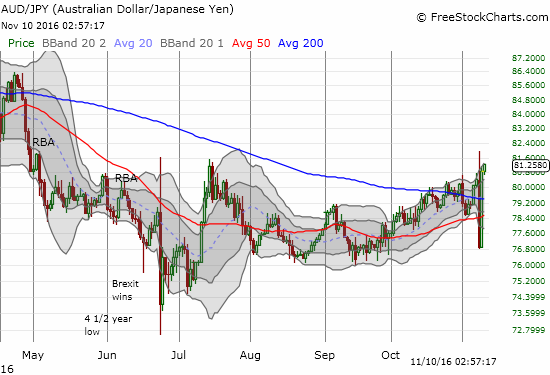
AUD/JPY reverses from a bearish breakdown and back to a VERY bullish breakout.
The return to a bullish breakout definitively confirmed the simultaneous rally in financial markets and kept me confident in my market bullishness through the entire wild election trading.
However, the wild and wide-ranging reaction in the U.S. dollar completely startled me. I went from thinking that the profits in AUD/JPY helped fund my U.S. dollar losses to celebrating a whopper of a rally in my long U.S. dollar positions.
The U.S. dollar sank rapidly as financial markets began to process a likely Donald Trump victory. Right before or shortly after the victory was a done deal, the dollar promptly reversed its losses. By the close of U.S. markets, the dollar managed a net GAIN of 0.7%. I use EUR/USD to break down the overnight trading action.
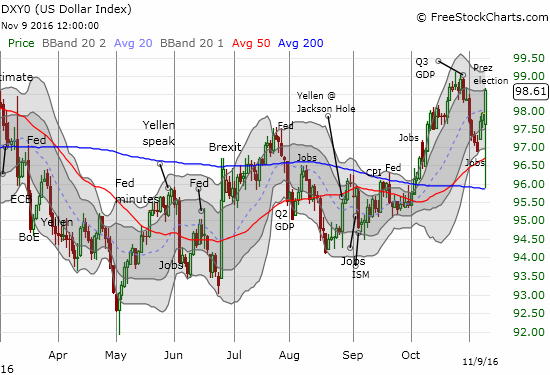
The U.S. dollar index (DXY0) ended its first post-election day with a 0.7% gain, but it is still short of the most recent high.
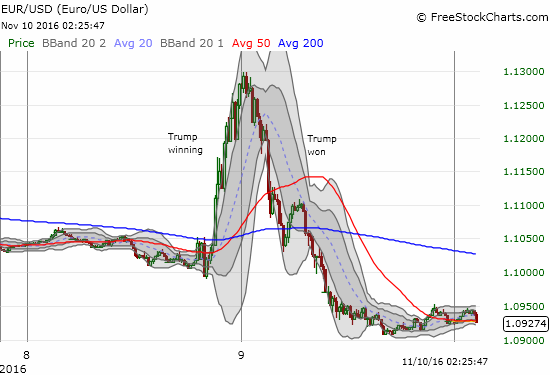
This 15-minute chart shows how the U.S. dollar first rapidly retreated against the euro and then gained almost as fast. The dust settled with a net loss for EUR/USD.
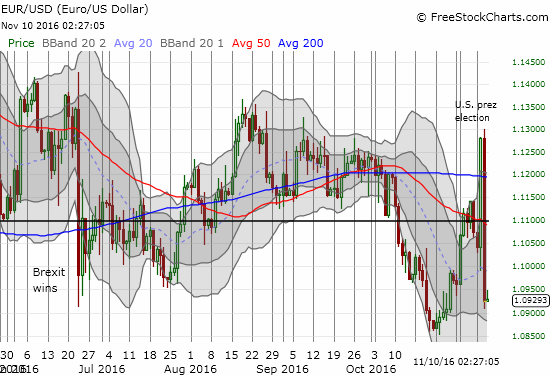
The daily chart shows how the post-election wild ride for EUR/USD mirrors the immediate reaction to Brexit back in June.
I think these moves demonstrated massive confusion in the currency market on the implications of a Trump presidency. One could argue numerous pros and cons that can loop you around and around. I will assume that the argument that prevailed in the end is that Trump’s displeasure with the low interest rate environment in America has all but guaranteed that the Federal Reserve will feel the heat to finally end its dithering and hike rates at its December meeting.
The chart below shows how the odds of a rate hike have risen since the jobs report for October. The election pushed the odds of a December rate hike from 76.3% to 81.1%.
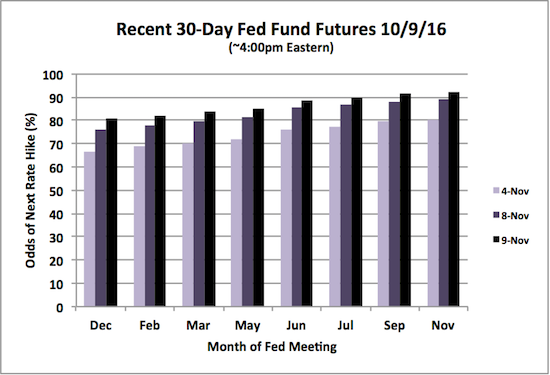
A steady rise in the odds of an imminent rate hike.
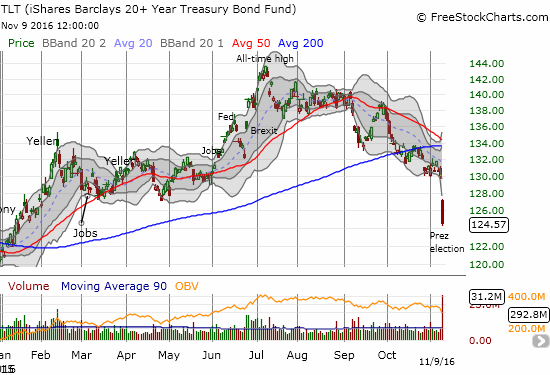
The massive gap down for iShares 20+ Year Treasury Bond (NASDAQ:TLT) confirmed a 200DMA breakdown. Interest rates are heading higher….!
With interesting rates soaring and the U.S. dollar in rally mode going into the U.S. open, I would have expected gold to get a major smackdown. Instead, SPDR Gold Shares (NYSE:GLD) gapped up 2.2%.
GLD fell fast from there and closed near flat with the previous close below 200-day moving average (DMA) support. My position in VanEck Vectors Gold Miners ETF (NYSE:GDX) soared at the open as well.
While I wanted to lock in the profits, spreads were very wide and I feared I would get a poor price (I had that happen on some other positions I quickly closed out). By the time spreads stabilized, GDX had already faded much of its gain on the day.
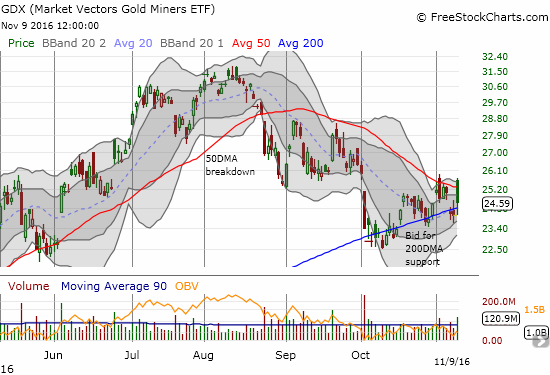
VanEck Vectors Gold Miners ETF (GDX) continues its 200DMA gyrations.
The Canadian dollar (via Guggenheim CurrencyShares Canadian Dollar (NYSE:FXC)) also perplexed me as it had the exact opposite election-driven reaction: the currency weakened against the U.S. dollar first and then strengthened. This behavior finally motivated me to go back and review the last monetary policy decision from the Bank of Canada.
I very belatedly learned about the extremely dovish tone, the cuts to growth forecasts, and the revelation that export growth has not accompanied currency weakness as previously expected. The daily chart shows how the Canadian dollar has sold off since the Bank of Canada. The 15-minute chart breaks down the Trump-driven reaction.
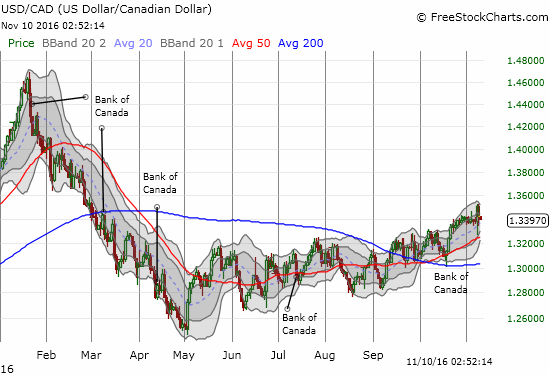
The Bank of Canada arrived just in time to support the rally in USD/CAD at its 200DMA
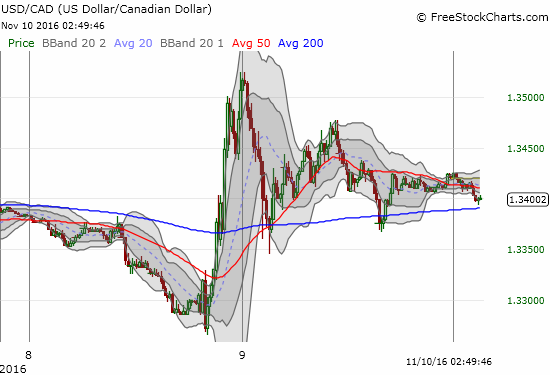
While other currencies were beating up on the U.S. dollar as election results arrived, the Canadian dollar was losing ground. The exact opposite occurred after the market accepted a Trump victory.
I am now getting active again in the Canadian dollar. Going into the election, I was holding a short USD/CAD position as a small hedge on my long dollar positions. The reverse behavior forced me to dump the position. I am now trading USD/CAD on its own merits. Until recently, the Canadian dollar was decoupled from oil. With other commodities soaring lately, the stubborn weakness in the Canadian dollar sticks out even further.
Going forward, I am slowly rebuilding my market hedge with a short on AUD/JPY. As the chart above shows, I am getting very good prices on this important hedge. I am also near the point of FINALLY closing out my net long U.S. dollar position.
With the Fed’s presumed rate hike around the corner, I am wary. I strongly suspect the market will go into classic contrarian/sell-the-news form and dump the U.S. dollar after a rate hike. If the Fed fails to hike rates, well, traders will likely dump the U.S. dollar…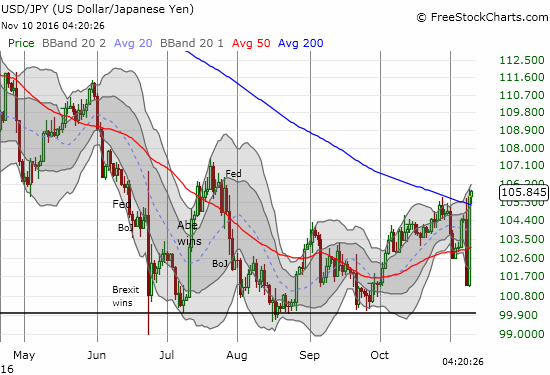
The U.S. dollar FINALLY broke out against the Japanese yen. A confirmation should propel USD/JPY a lot higher as the 100 floor also gets confirmed – thus signaling an end of the yen bull that has dominated 2016.
Full disclosure: short AUD/JPY, net long the U.S. dollar, long GLD, long GDX, long TLT call options and spread
