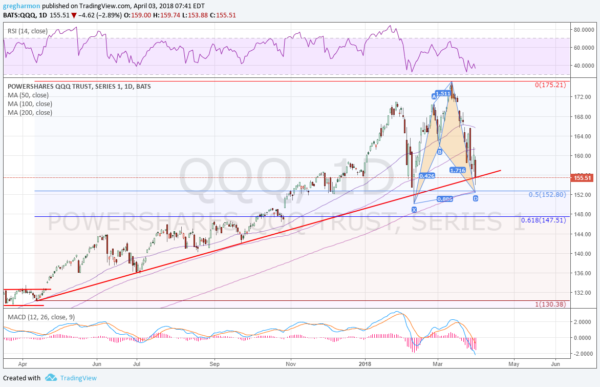
The Nasdaq 100 has gone through a crazy period since the beginning of the year. First a meteoric rise, then a steep sell off. This was followed by another all-time high and now a second sell off. It is almost as f it has two personalities fighting within it, a Dr Jekyll and Mr. Hyde scenario. With Mr. Hyde seemingly firmly in control, what does it mean for the Nasdaq 100? The chart of the Nasdaq 100 ETF, PowerShares QQQ Trust Series 1 (NASDAQ:QQQ), below gives some insight and things to think about.
This chart shows the price action since April 2017, when the ETF started to move higher out of consolidation. You can see it was a calm and steady rise until November, when it accelerated a bit, and then increased the pace higher again in January. Then crazy time began. There are a couple of things to note about this last 2 months.
First, on a longer scale the price has only just fallen back to the rising trend line that it rode higher from last April. There have been two intraday breaks but the trendline has held.This is why many are still longer term bullish and see this as a digestive or ‘healthy’ correction. You may not agree with the descriptors but until that trend line is violated price has done nothing more than revert to the mean, in a sense.
Second, note that price has retraced almost 50% of the total move up. That 50% level currently coincides with the 200 day SMA. It has been 21 months since the price has touched the 200 day SMA. Notice that point is also the Potential Reversal Zone (PRZ) of a bullish Shark harmonic pattern. It would seem that this price level, despite being below that rising trend line, has some significance. At about 152.75, this could make it a magnet in the short term attracting price as multiple styles of traders look at the level.
It may act as support, or it may not. Should price continue lower there is a secondary PRZ at 147.45. Notice that a move to that level would retrace 61.8% of the run higher, and close the gap that was left open from a move higher in October. So there are 3 prices to watch in the short run in the Nasdaq 100 ETF. Losing support at all 3 would gather some bearish steam.
The information in this blog post represents my own opinions and does not contain a recommendation for any particular security or investment. I or my affiliates may hold positions or other interests in securities mentioned in the Blog, please see my Disclaimer page for my full disclaimer.

