Consumers, as opposed to manufacturers, represent two-thirds of the U.S. economy. Indeed, Americans love to splurge. We buy sneakers, iPhones, home furnishings, real estate, cars, jewelry, concert tickets, and meals at our favorite restaurants. We even buy chew toys for our pets.
Many of us, however, do not have enough cash saved up to acquire the things that we want when we want them. So we borrow. We satisfy our cravings through instruments of debt – credit cards, mortgages, “refis,” equity lines and school loans.
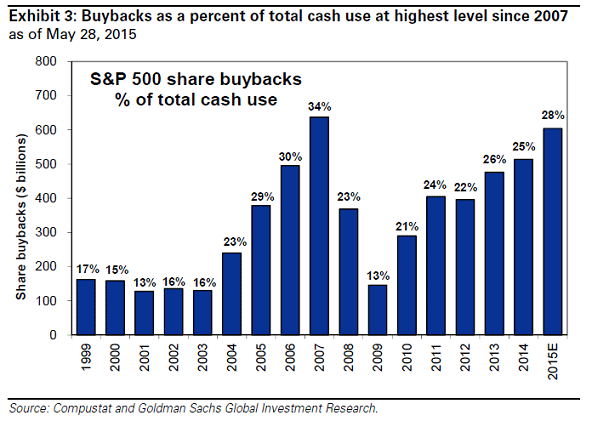
Like consumers, there are scores of corporations that borrow more than they should and gorge when ultra-low interest rates beckon. How do companies do it? They issue low-yielding bonds to yield-seeking investors. Theoretically, companies can use the newfound dollars on research, development, marketing, equipment and human resources. In 2015, though, public corporations are spending an estimated 28% of their available cash on acquiring shares of their stock. That’s the highest percentage since 2007.
Why do companies buy so much of their own stock in what the investing community calls “share buybacks?” Less stock in the marketplace limits supply, boosts the perception of profitability per share and artificially boosts buyer demand; prices tend to move higher.
Stock prices rise in the early stages of accelerating corporate share buybacks. For instance, in the bull market of 2002-2007, public companies committed more and more of their total cash; the higher the prices moved, the less shares that corporate borrowed dollars could afford. As buybacks peaked in 2007, they rapidly descended during the 2008-2009 financial collapse.
Now look at the current economic recovery since the 2nd quarter of 2009. Share buybacks have been on a strong upward trajectory, pushing stock market benchmarks to new heights. In fact, one of the big reasons that so many executives have been lobbying the U.S. Federal Reserve to hold off on hiking borrowing costs in September is because those costs would adversely impact the financing of stock buybacks at ultra-low bond yields.
Are consumers and corporations the only groups that salivate over ultra-low interest rates? Hardly. The federal government debt is rapidly approaching $19 trillion. In particular, obligations have grown by approximately $8 trillion since the recovery’s inception – a pace that is more than twice as fast as the growth of the U.S. economy itself. That’s right. Uncle Sam is spending borrowed dollars at an alarming clip, guaranteeing that higher and higher percentages of total tax revenue will be used for debt servicing. (Recognize that nobody believes in the notion that debts could ever be paid back.)
Why might this be troublesome at this particular moment? The Federal Reserve has wanted to hike borrowing costs as early as mid-September. And that means that Uncle Sam will likely be paying higher rates to service the interest charges on its treasury bonds very soon. What’s more, if the Federal Reserve hikes borrowing costs, consumers will have to pay more to service adjustable loans and mortgages; businesses will have to pay more to service the interest on corporate bonds. The probable result? The economy slows and possibly contracts such that Uncle Sam brings in less-than-anticipated tax revenue.
Indeed, the Fed has been spooking markets with its desire to move toward “rate normalization.” If committee members spoke candidly about a more realistic intention – a plan to move no more than 1% off of the zero percent anchor by the end of 2016 – there would be an end game that global investors could factor into decision making. Instead, there is fear that the Fed is misreading the tea leaves on the health of the U.S. economy as well as fear that the central bank would move to far in the wrong direction.
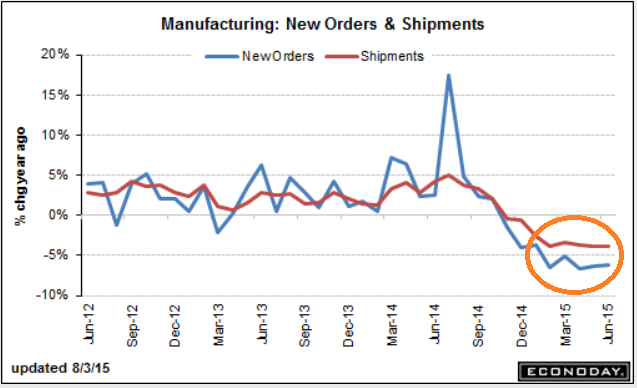
Consider the manufacturing slowdown – the “less important” one-third of the U.S. economy. Does anyone doubt that U.S. manufacturing has suffered due to the global manufacturing slowdown and the outright recessions in places like Canada, Brazil and parts of the euro-zone? The recent jobs report by ADP confirms it. Of the 190,000 jobs created, 173,000 received the tag of “service-providing” whereas a meager 17,000 had been deemed “goods-producing.” Should we dismiss that oil giant Conoco Phillips is laying off 10% of its global workforce? What about critical metrics such as factory new orders and product shipments? The percentages for both are negative on a year-over year basis.
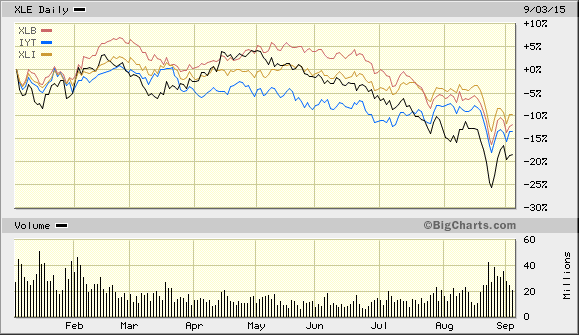
Global manufacturing woes did not just hit the investment markets in August; rather, the declines have been developing in key economic sectors since the fourth quarter of 2014. Every significant manufacturer-dependent sector in the exchange-traded investing world- iShares Dow Jones Transportations (NYSE:IYT), Industrials Select Sector SPDR (NYSE:XLI), Energy Select Sector SPDR (NYSE:XLE), Materials Select Sector SPDR (NYSE:XLB) – is down 10% or more year-to-date.
It follows that the U.S. economy is even more dependent on the consumer than it ought to be. And by extension, consumer credit as well as service-oriented business credit become more critical than they might otherwise be. And what affects credit more than the Federal Reserve?
Until investors learn the what, when and why of Fed policy guidance, riskier assets will remain volatile. Intra-day price swings of 300 points on the Dow? We should feel lucky if it remains that subdued.
As regular readers already know, I began reducing client exposure to risk before the mid-August price plunge. We raised cash/cash equivalents in our accounts. Those levels are roughly 25% for moderate growth investors. The cash is there to reduce portfolio volatility, minimize depreciation in portfolios and provide opportunity to buy quality assets at lower prices. We also have 25% allocated to investment-grade income.
Whereas moderate risk clients may typically have 65%-75% in stocks, we gradually reduced that level to 50% across June and July. Our reasons for the tactical asset allocation shift? I presented them in “A Market Top? 15 Warning Signs” when the S&P 500 traded in and around the 2100 level. The 50% allocated to stock is spread across a variety of large-cap U.S. ETFs, including but not limited to, iShares S&P 100 (NYSE:OEF), Vanguard High Dividend Yield (NYSE:VYM), Health Care Select Sector SPDR (NYSE:XLV) and Vanguard Mid-Cap Value (NYSE:VOE).
Disclosure: Gary Gordon, MS, CFP is the president of Pacific Park Financial, Inc., a Registered Investment Adviser with the SEC. Gary Gordon, Pacific Park Financial, Inc, and/or its clients may hold positions in the ETFs, mutual funds, and/or any investment asset mentioned above. The commentary does not constitute individualized investment advice. The opinions offered herein are not personalized recommendations to buy, sell or hold securities. At times, issuers of exchange-traded products compensate Pacific Park Financial, Inc. or its subsidiaries for advertising at the ETF Expert web site. ETF Expert content is created independently of any advertising relationships.


