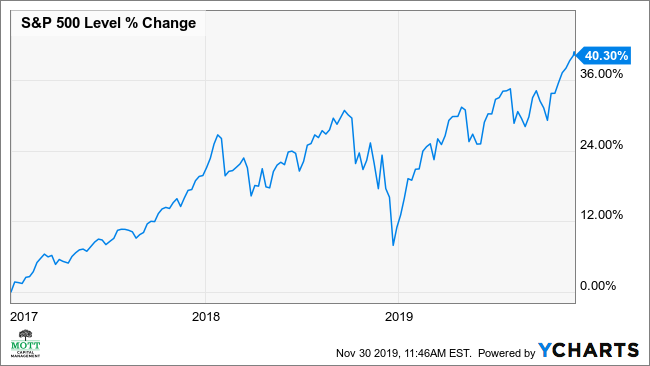
The S&P 500 has advanced by about 26% in 2019; the gains aren’t as impressive as they sound. Since 2018 began, the S&P 500 has jumped by just 17.5%. It is important to remember that much of this year’s significant gains are due more to a fourth-quarter 2018 meltdown then due to a fantastic equity market. That’s right; since October 3, 2018, the S&P 500 is up just 7.4%. Not so impressive when stated that way now is it.

Inflated Gains
I’m not going to get into why the market collapsed in the fourth quarter of 2018, because there was more than one factor at work. From fears of slowing global growth to collapsing oil prices, to a Fed that was overtighten and draining liquidity, to fourth quarter tax-loss selling, and a government shut down, and just a horrible time of the year, were all at play.
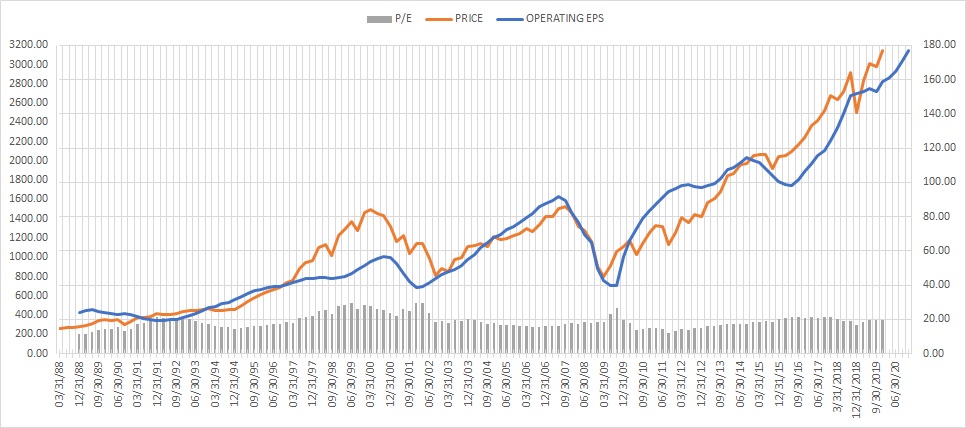
Think about it this way at the end of 2016, earnings on a trailing twelve-month basis were $106.26 per share; they rose to $124.51 in 2017, a gain of 17%. That was followed by an increase of 21.76% to $151.60 in 2018, and if all goes right, earnings should grow by 4.7% in 2019 to $158.68. In all earnings have increased by 49.3% from 2016 through 2019. Not too bad. Meanwhile, for all those giant earnings gains, the S&P 500 has risen by 40.3%. It is hard to say the S&P 500 has kept pace with earnings growth.
Multiple Contraction
On December 31, 2016, the S&P 500 was trading at 21 times 2016 earnings of $106.21. By the end of 2017, the S&P 500 was trading at 21.5 times the 2017 earnings of $124.51. By then end of 2018, the S&P 500 was trading at 16.5 times 2018 earnings of $151.60. Meanwhile, today, the S&P trades at 19.9 times 2019 earnings estimates of $158.68. So despite all the significant gains, in reality, the market has not even kept pace with earnings growth, as evidenced by the lower market multiple.
Multiple Expansion
Based on current estimates for 2020 of $176.74, the S&P 500 is trading at 17.8 times estimates. To get back to the 19.9 times we are at are currently, the index would need to climb to 3,517 in 2020. It would amount to a gain of 57% since the end of 2016 for the S&P 500. It would come to a gain of 66.3% in earnings over the same time. I have largely been targeting a lower valuation of around 3,350 in the past, because I have been using more conservative earnings multiple, based on the historical average of 19. The 3,350 level is still the level that I feel is more realistic at this point.
One Constant
It is hard to know what the future will bring, but when it comes to the equity market, the constant over time is that the market always resorts to track earnings growth. Despite all the headlines you will read in the final weeks of the year about how good the equity market has been this year, realize it not the full truth. The equity market has mostly performed average at best since the beginning of 2018, rising by 17% or about 8.5% per year.

When thinking about it that way, do you think the equity market is topping out, or perhaps has even further to climb? You can decide.
You already know where I stand.
