I just finished updating The Demographic Cliff — my most recent bestselling book on Amazon — for the paperback edition set to come out in August. In it I predict two likely scenarios for the rest of this year and next:
In scenario one, the market takes a near 20% correction. While we’re in uncharted territory with this endless quantitative easing nonsense, I still consider this a likely outcome. If it happens, the Fed would not only put off raising interest rates indefinitely… but it may even announce another round of quantitative easing: QE4. Or at least threaten to.
The markets would like that at first. But after that, a big crash would follow, likely starting in early 2016. You just can’t inflate this bubble much more.
Then there’s the second scenario…
In scenario two, the market makes its final long-term top in the broader “megaphone” pattern (where new lows precipitate new highs, and vice versa) now or in the very near term.
If this plays out, we could expect to see a 20% crash this summer. That would merely represent the first wave of the larger crash we see as inevitable ahead. Ultimately that would lead the Dow down to 6,000 or even 5,500.
Whichever scenario plays out, this looks like a dangerous period for stocks ahead. Mind you, historical analysis has shown over many decades that most of the corrections, on average, come between very early May and mid-October in any given year.
2015 is shaping up to be one of those years.
Getting out of stocks or playing more defensively would have worked very well in the most volatile years such as 2008, 2010, 2011 and 2014. It would not have worked as well in 2009, 2012 and 2013 — especially 2009 after coming off a major bottom.
2014 may have been a good year for stocks overall, but in that period between early May and mid-October, they actually fell. And the fact that they’ve been struggling to make even slight new highs since December means the market seems to be losing momentum, going along with the slower growth trends we’ve been forecasting for 2015.
Hence, a more substantial correction approaching 20% is likely for 2015.
The NASDAQ was inching towards its early 2000 high of 5,132 just this past Monday. It’s dipping back beneath that now, showing strong resistance to that all-time high. That’s all the more reason to tread lightly going forward.
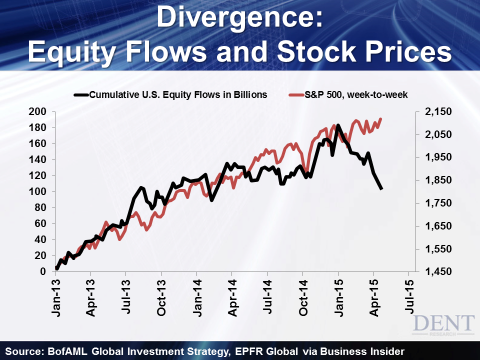
Then there’s another reason to be worried about stocks in the near-term. Just see the chart below:

That’s a very important correlation that’s starting to unravel! A recent Bank of America Merrill Lynch survey shows that investors have pulled $79 billion out of the stock market just this year. That goes hand-in-hand with the chart, as cumulative equity flows pull out of the market.
The last time flows started to weaken was in early April of last year, about six months ahead of the 10% crash and low into mid-October. But now the divergence between outflows and stocks is much greater, and it started in late December. That would suggest, as I said above, a 15% to 20% stock crash by late June or July this summer.
And what have I been warning for months now? Given the fact that bubbles crash at least twice as fast as they build, it’s better to get out a bit early than a bit late.
We’ll monitor the next correction closely to see where stocks go. They may top in the coming weeks and fall from there, or may make one more rally to new highs.
Either way, volatility looks increasingly more likely the rest of this year and next. So review your investments accordingly. Are those possible slight new highs worth sitting through a 20% correction? And what if this is the major top?
If I were a passive investor, I’d be running for cover…
