Who is Kevin Hassett? Wolfe looks at the Trump ally tipped to become Fed Chair.
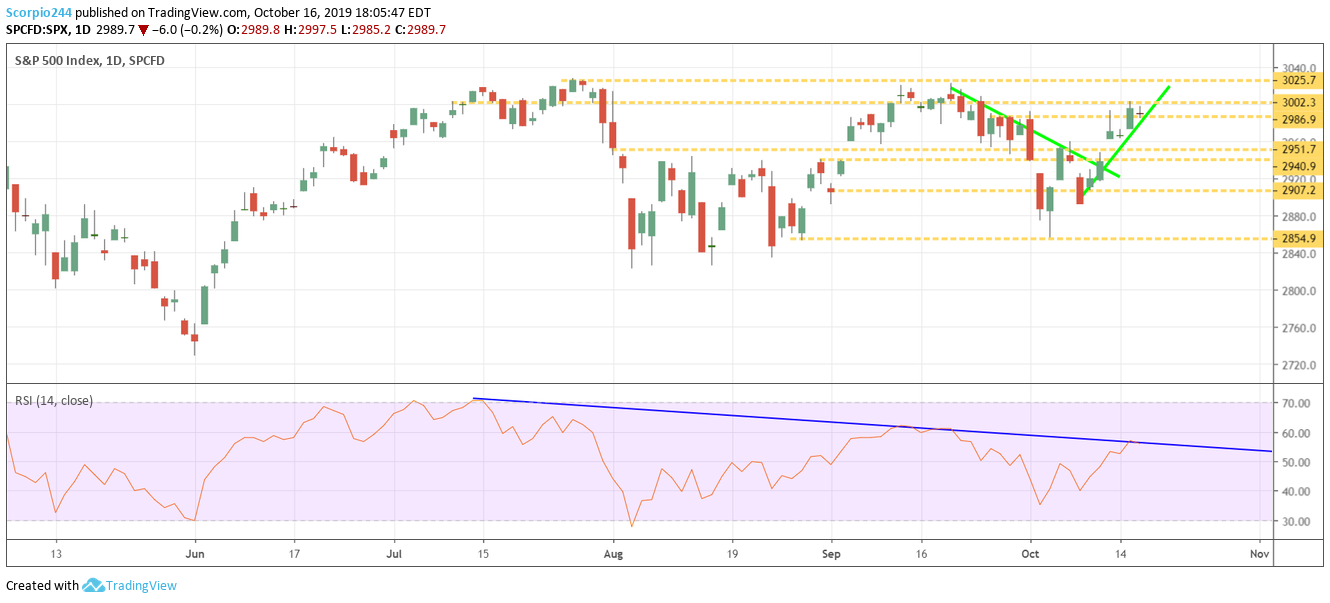
Stocks had an ok day falling by about 20 basis points to finish at 2,989. I noted yesterday in the mid-day update that index was likely to hold support at 2986 and the uptrend, which is pretty much what happened. The good news is that formation created in the index appears to be a rising triangle.
It would indicate to me that S&P 500 is getting closer to a breakout above 3,000, which will push the index to 3,025. Then, if the patterns holds, leading to the most significant break out of them all at 3,025.
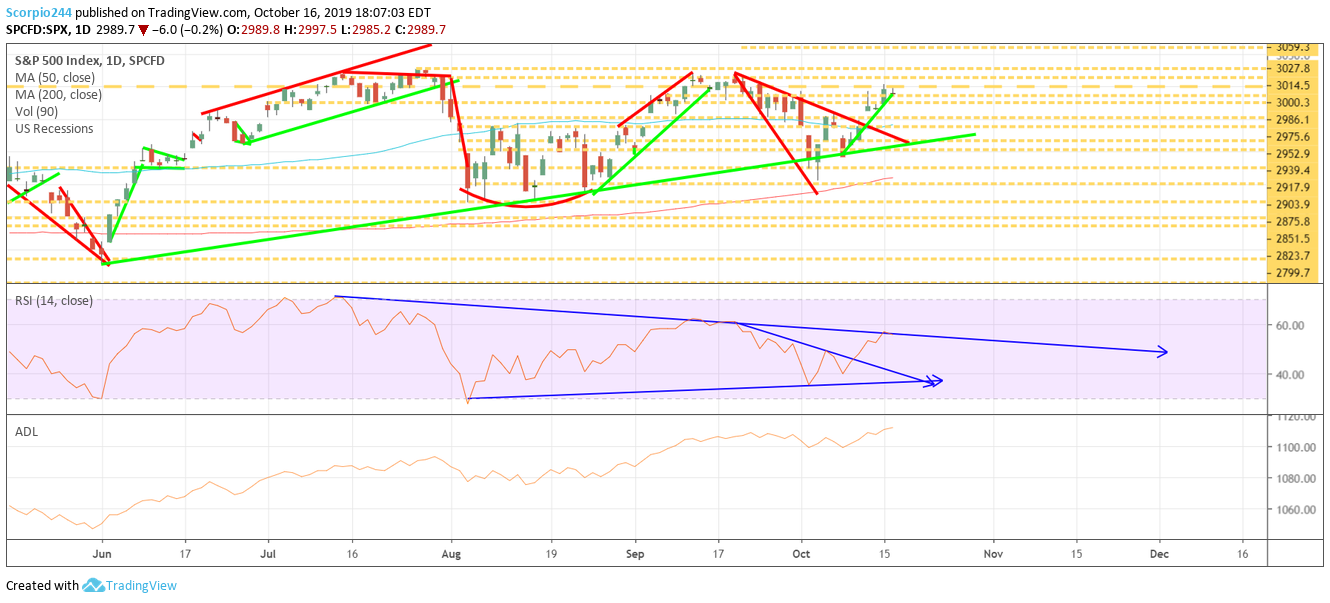
We can see in the old chart of the SPX how the advance/decline reached a new high yesterday. It is likely a sign of what is to come.
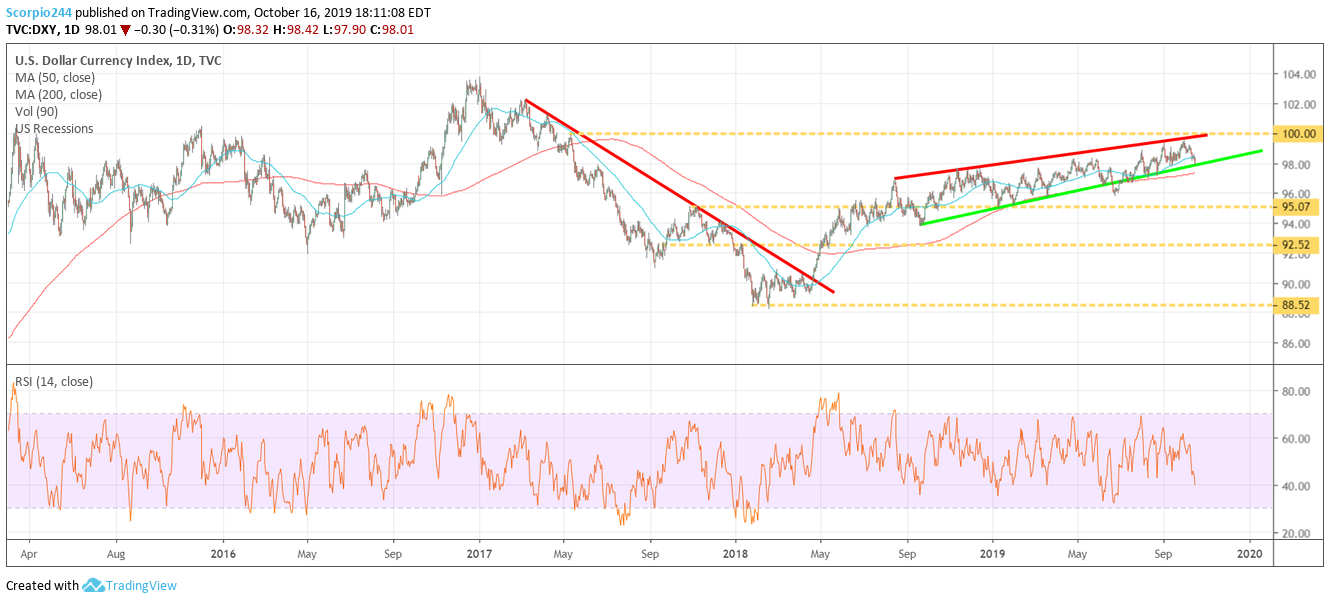
Dollar (UUP)
Watch the dollar. I feel like a broken record here, but once again it is on the cusp of a breakdown. I’d love to start seeing the dollar move lower. It would be great for lifting commodity prices. It would also be a positive for stocks and acting as a tailwind for revenue and earnings. That would be bad news for the bears.
Bond Spreads
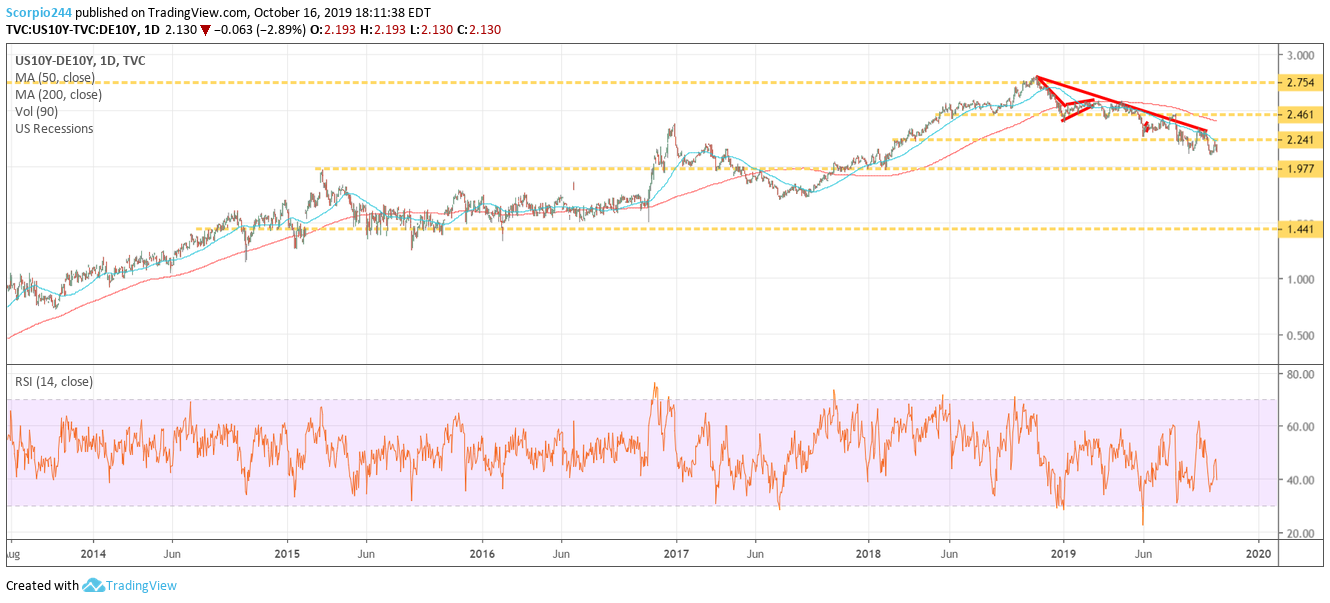
Look at how much spreads between the US and German bonds have fallen; the dollar should be weakening.
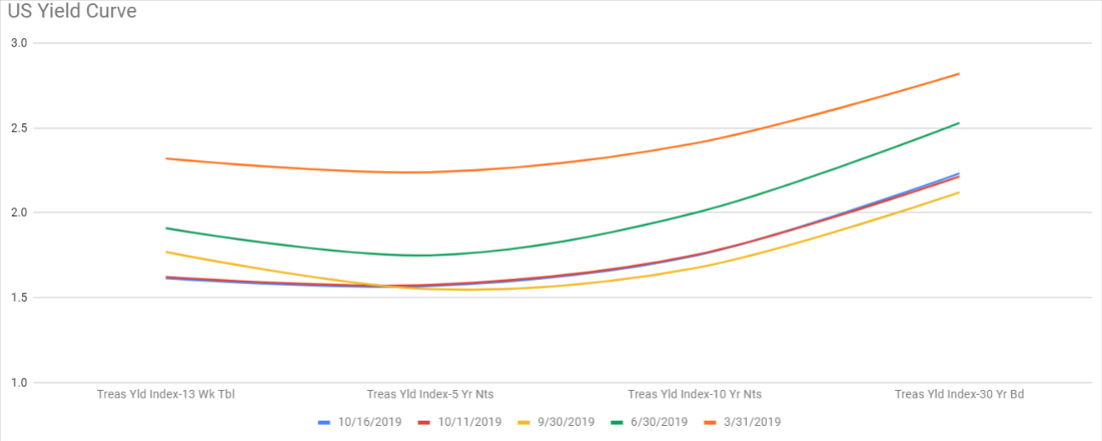
A Normal Yield Curve, Wait, What?
By the way, have you noticed how the inverted yield is now normalizing? Amazing. Rate cuts can work wonders.
Netflix (NFLX)
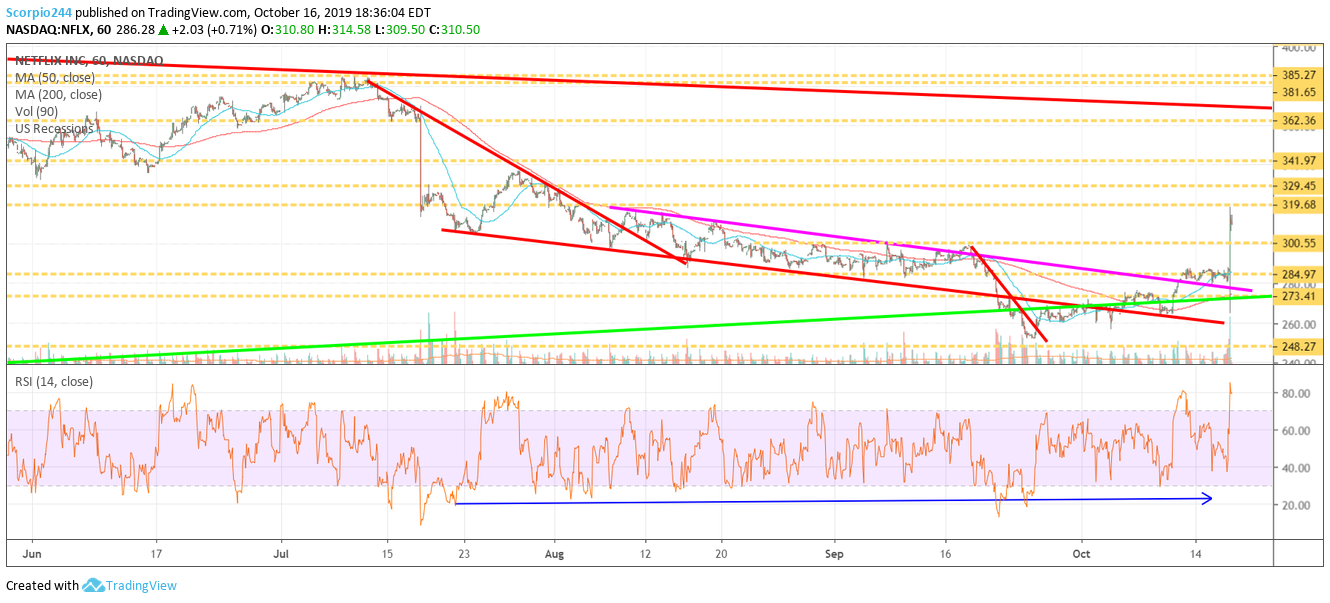
Netflix (NASDAQ:NFLX) traded last night up by about 10% to around $312. The results look solid to me; it kills the narrative that competition was an issue for them. It was there best third quarter ever. The red lines are for the second quarter.

I wrote previously,
The challenges Netflix) faces is nothing new – for years, they have already been fighting rivals such as Amazon (NASDAQ:AMZN) and Google (NASDAQ:GOOG) (NASDAQ:GOOGL), through Prime and YouTube, Hulu, and the traditional linear TV cable bundles.
The stock is rising after hours, hitting resistance at $319, and moving down some. I’d expect the stock to challenge $319 and move higher through the fourth quarter attempting to fill the gap at $362.
Tesla (TSLA)
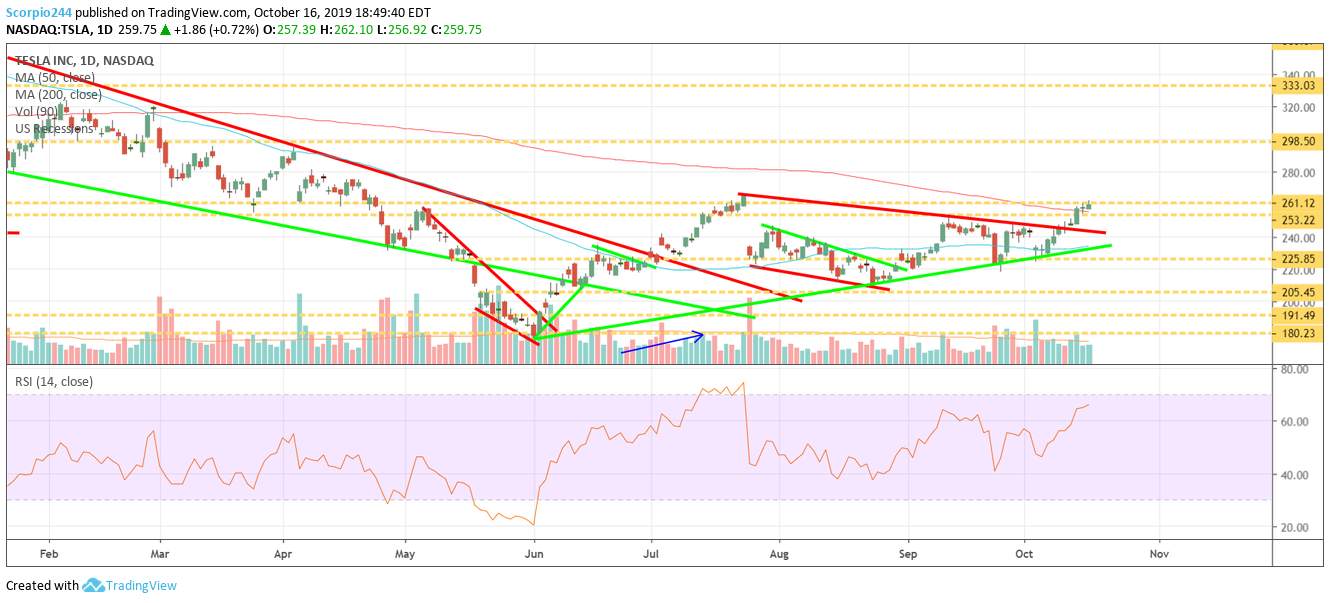
Now, if we can only figure out which way Tesla (NASDAQ:TSLA) is going. $266 is a significant level to watch. I still think $300 is possible this year.
Disney (DIS)
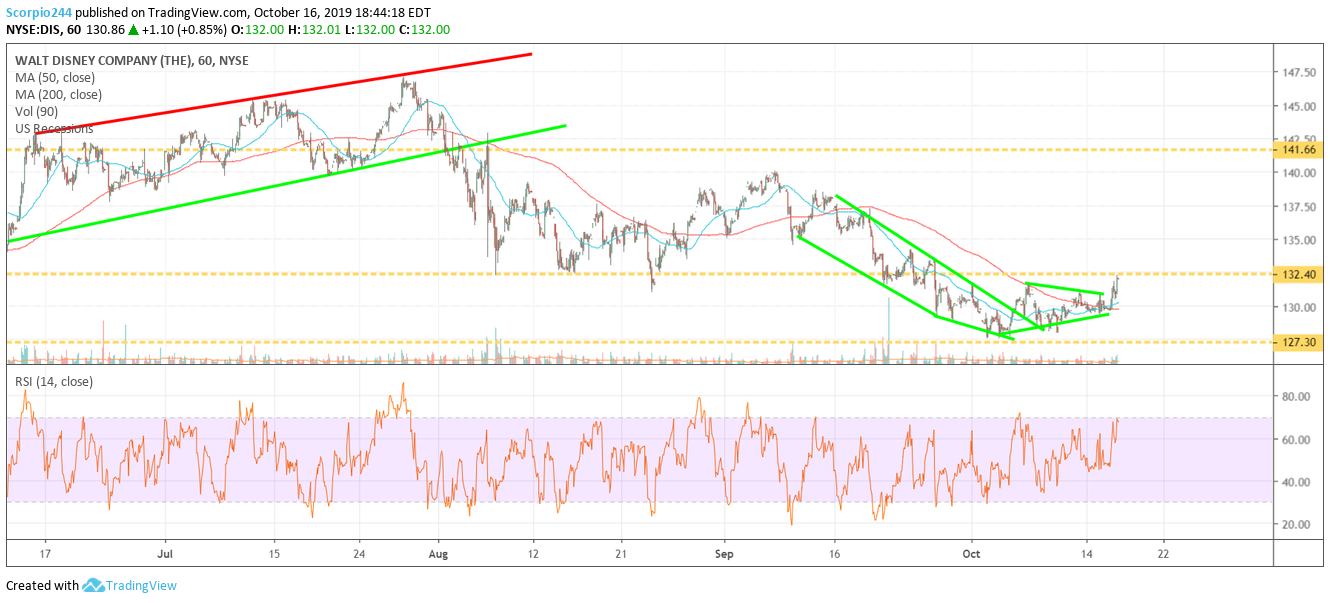
Disney (NYSE:DIS) is moving up on Netflix. Yesterday I noted some bullish options activity I saw in the stock for the SA Market Place Subs.
AMD (AMD)
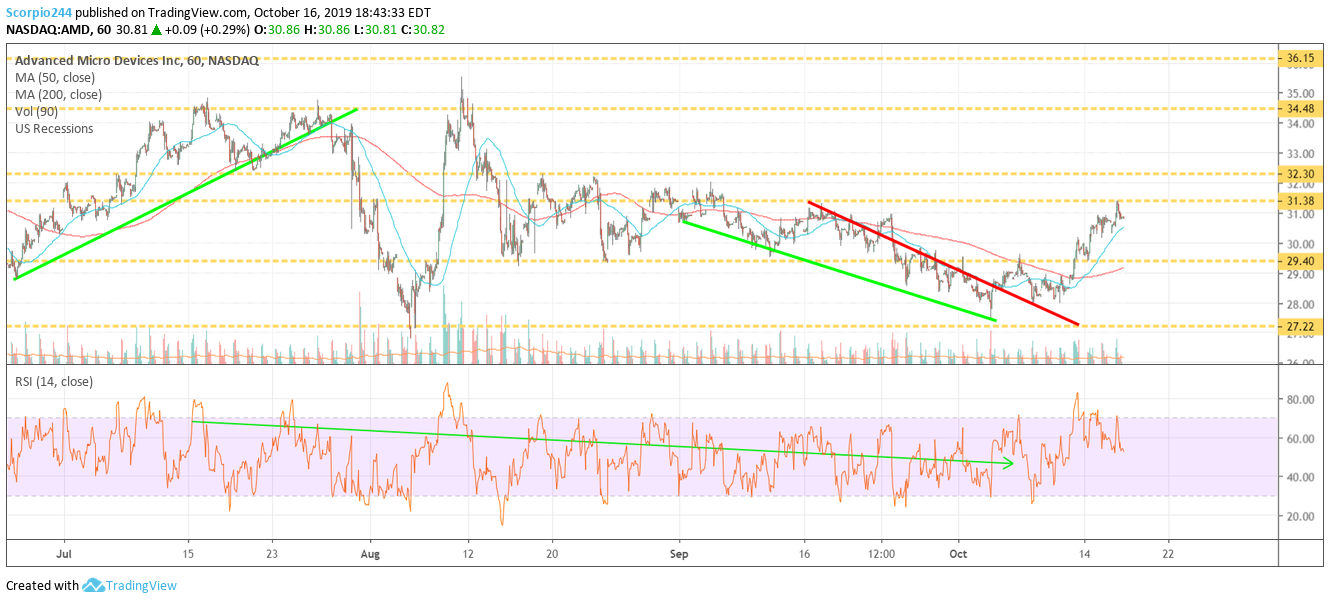
AMD had a good day hitting $31.40. That is the level we had been looking for since $28 on October 3. I’m glad it finally got there.
