AT40 = 61.0% of stocks are trading above their respective 40-day moving averages (DMAs)
AT200 = 63.0% of stocks are trading above their respective 200DMAs
VIX = 10.8 (volatility index)
Short-term Trading Call: bullish
Commentary
Going into the first round of the French Presidential election, I figured the best case scenario was the absence of a market sell-off. I never even considered the possibility that the prospect of the election was actually weighing on the stock market. After all, the euro (NYSE:FXE) was in recovery mode from its latest dip against the U.S. dollar (DXY0). EUR/USD showed no immediate concern with the election.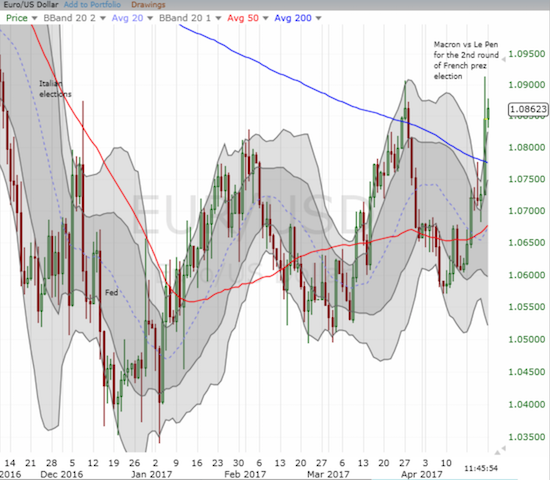
Thanks to the bullish response to the French Presidential election, EUR/USD is back to breakout mode.
Despite a small recent rise in net euro shorts, speculators were overall in the middle of their most extended retreat from net short positions since they last switched to euro bears almost three years ago.
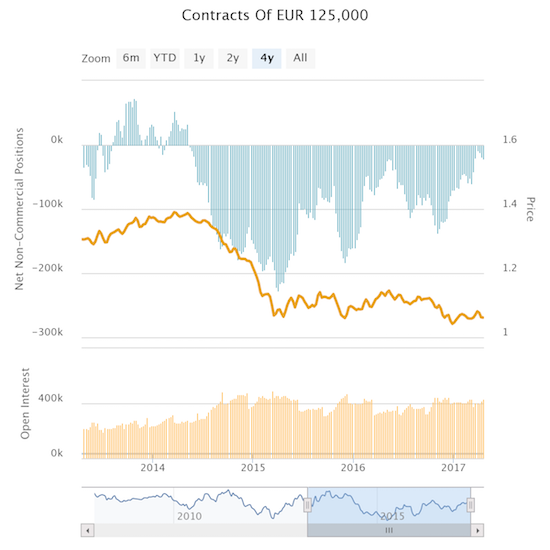
Speculators steadily reduced net short positions against the euro for weeks going into the French Presidential election
So, going into the weekend, while I remained bullish on the euro, I surely did not expect a tremendous surge on whatever would be interpreted as good news from the first round of the Presidential election. I am nicknaming this burst of euphoria the “French Fly.”
The French Fly was definitively bullish with important breakouts on the major indices. I even dropped “cautiously” from my short-term trading call. Traders smashed the short-term downtrend on the S&P 500 (via SPDR S&P 500 (NYSE:SPY) and scoffed at resistance from the 50-day moving average (DMA).
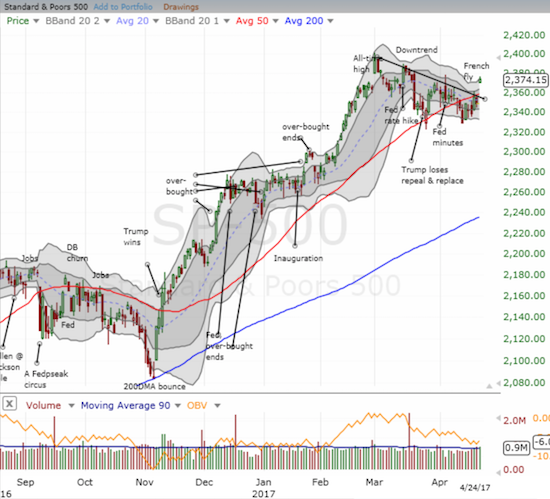
The S&P 500 (SPY) gapped up for a 1.1% gain. The breakout smashed through the short-term downtrend and 50DMA resistance.
The NASDAQ (PowerShares QQQ Trust Series 1 (NASDAQ:QQQ))* gapped up to a gain of 1.2% and closed above its upper-Bollinger Band (BB).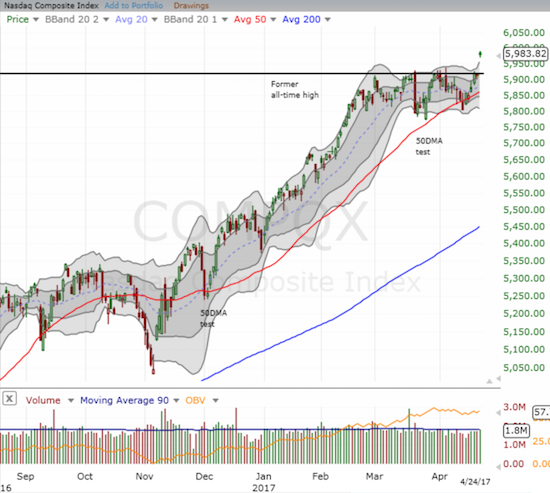
The NASDAQ (QQQ) made a big, bullish statement in leaving behind the previous churn.
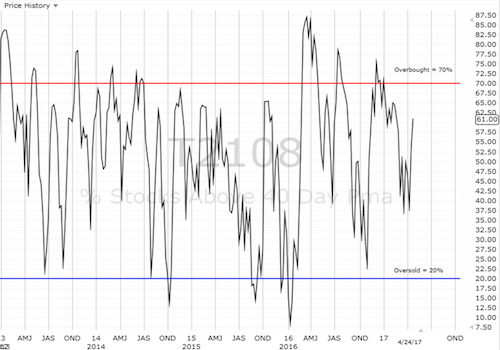
AT40 (T2108), the percentage of stocks trading above their respective 40DMAs, confirmed the breakouts with one of its own. AT40 jumped from 53.3% to 61.0%, a new 7-week high.
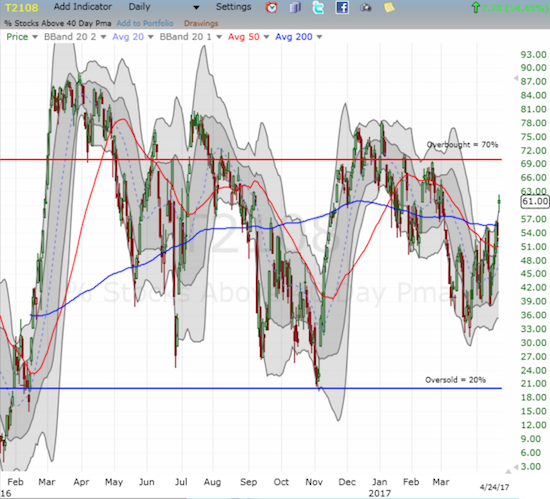
AT40 (T2108) broke out to a new 7-week high in a very bullish move.
The volatility index, the VIX, rounded out the signs of the latest collapse by the sellers and bears with a definitive return to the area of extremely low volatility (below 11.0). The VIX was absolutely smashed with a 25.9% drop.
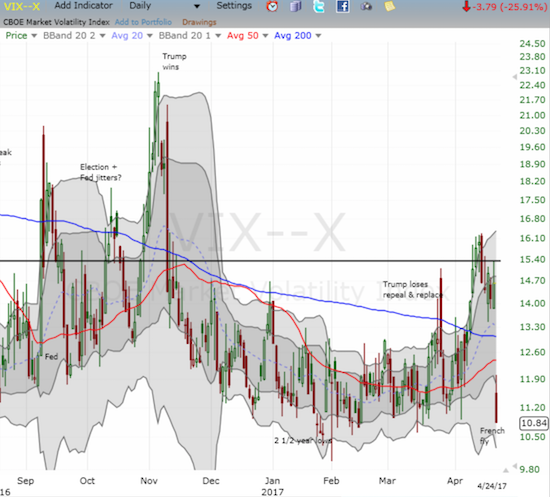
The volatility index, the VIX, closed at a 2-month low and near 2 1/2 year lows.
Recall that the immediate implications of extremely low volatility are bullish, not bearish. I am not sure whether the clock on a May pullback is still ticking or whether I have to hit the reset button. Regardless, I am a bit surprised that the steady elevation in the VIX up until Monday ended so dramatically…again, because I simply did not appreciate just how much the French election was actually weighing on sentiment.
Note that the currency market has not given its “all clear” just yet. The Australian dollar (NYSE:FXA) versus the Japanese yen (JPY) has yet to break free of 200DMA resistance. I am sticking with my shorts against the Australian dollar.
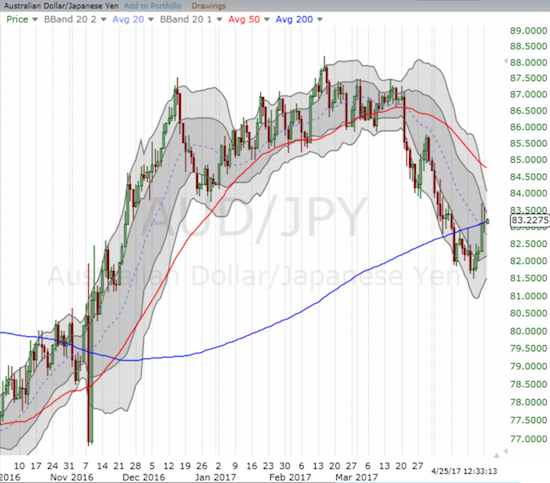
AUD/JPY jumped along with financial markets but faded back to 200DMA resistance. I will be closely watching for a clean breakout.
The timing of this breakout means that I missed out big with my call options on ProShares Ultra S&P500 (NYSE:SSO) expiring on Friday and getting stopped out of a swing trade on ProShares Short VIX Short-Term Futures (NYSE:SVXY) a week and a half ago. SVXY gained 10.8% today – ouch. I was still holding put options on ProShares Ultra VIX Short-Term Futures (NYSE:UVXY) and sold those for a small gain (I sold at the open). The market was generous enough to let me back into a fresh tranche of SSO call options at my bid price. Hopefully this tranche fares better than the last.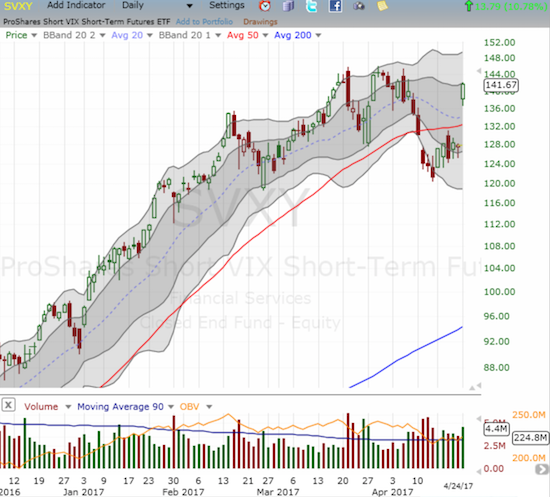
The ProShares Short VIX Short-Term Futures (SVXY) soared close to its all-time high.
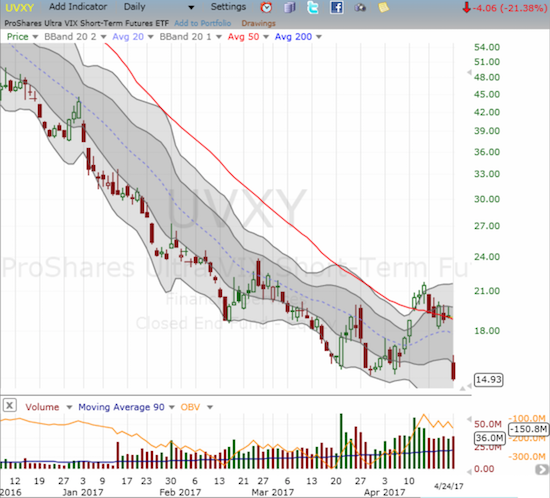
The ProShares Ultra VIX Short-Term Futures (UVXY) plunged to a new all-time low and a 21.4% loss.
I also bought call options on iShares MSCI Emerging Markets (NYSE:EEM) assuming that risk-on is back with a vengeance.
The day was far from roses and wine. One of the few purchases I made last week was Micron Technology (NASDAQ:MU). I even loaded up on shares and call options as the stock started to bounce from a gap fill. Inexplicably, the stock faded from its high of the day to close with a loss of 2.8%. This is a pretty bearish move that suggests a direct test of 50DMA support is coming. I will not be surprised if support gives way.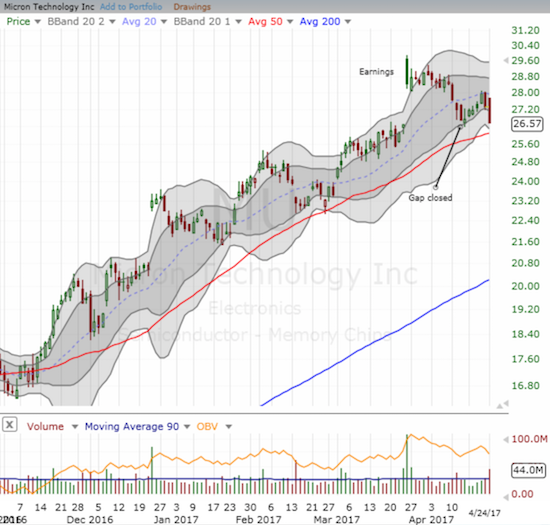
Micron Technology (MU) cut sharply against the grain as it closed at a new post-earnings low.
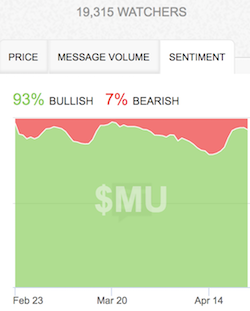
At least StockTwits traders are still raging bulls on MU…
Now we stay tuned for more political drama on the domestic front with the potential for a government shutdown, wrangling over tax reform, and then back to the second round for the French Presidential election on May 7th…
Be careful out there!
“Above the 40” uses the percentage of stocks trading above their respective 40-day moving averages (DMAs) to assess the technical health of the stock market and to identify extremes in market sentiment that are likely to reverse. Abbreviated as AT40, Above the 40 is an alternative label for “T2108” which was created by Worden. Learn more about T2108 on my T2108 Resource Page. AT200, or T2107, measures the percentage of stocks trading above their respective 200DMAs.
Active AT40 (T2108) periods: Day #296 over 20%, Day #116 over 30%, Day #6 over 40%, Day #3 over 50%, Day #1 over 60% (overperiod ending 36 days under 60%), Day #68 under 70%
Daily AT40 (T2108)
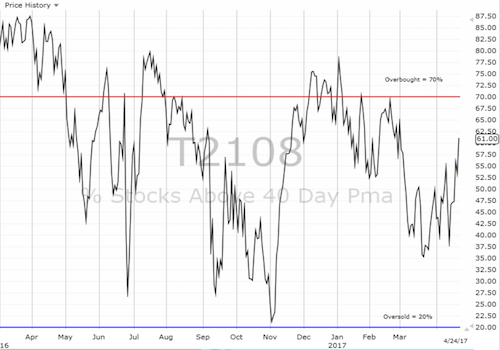
Black line: AT40 (T2108) (% measured on the right)
Red line: Overbought threshold (70%); Blue line: Oversold threshold (20%)
Weekly AT40 (T2108)
Be careful out there!
Full disclosure: long SSO shares and call options, long MU shares and call options, long FXE call options, long EEM call options, short AUD/JPY, long EUR/USD
*Note QQQ is used as a proxy for a NASDAQ-related ETF
