It’s almost as if President Trump was tempting fate when he tweeted "great news"” about the rebound in the US stock market. Or perhaps he was beckoning Wall Street to have another stab at driving markets lower.
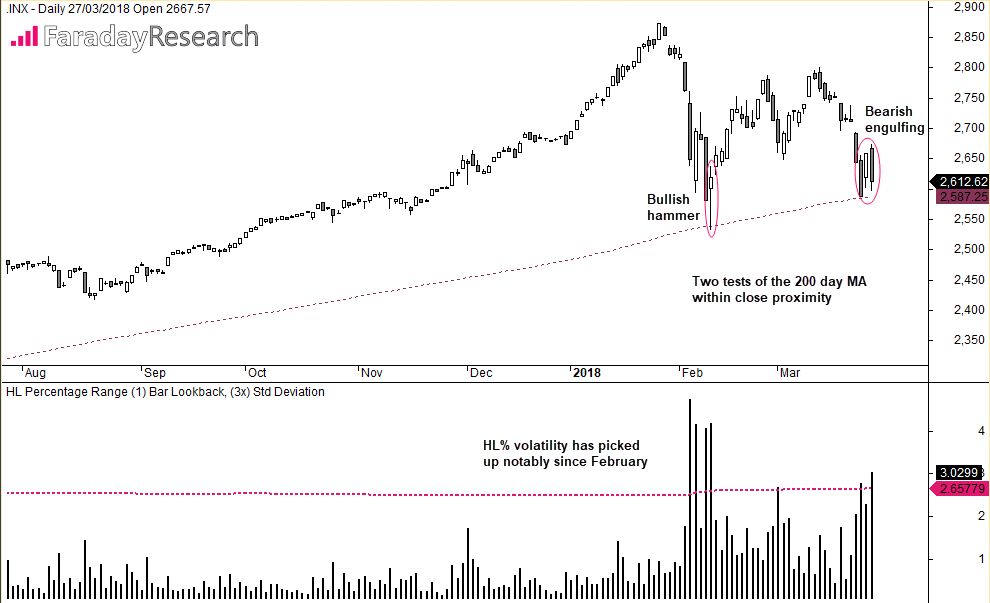
Within 24hrs of congratulating the third best single-day gain for Dow Jones Industrial Average , US markets are on the back ropes again and the S&P 500 is tantalisingly close to its 200-day average.
Love it or loathe it, the 200-day average is watched the world over and we doubt its escaping the limelight. In fact, we could go as far to say it could be used as directional cue for sentiment, depending on which way US markets break. The 200-day average can be a tough nut to crack but, when it does, it can leave one heck of a mess.

Since breaking above the 200ma in March 2016 there have been four failed attempts to break beneath it. Yet as two of those occasions have been seen in February and March this year, it suggests things could be getting tough at the top. Furthermore, daily high to low (HL) volatility has picked up notably. Using a 5-year daily rolling average, daily HL% has exceeded its own 3rd standard deviation on seven occasions. And with four of those sessions exceeding 4% ranges, daily volatility has hit levels not consistently seen since 2011.
We also note the bearish engulfing candle (which consumed the single-day rebound Trump tweeted about), and how this differs from the apparent springboard the bullish hammer provided back in February. And with no obvious signs of a bottom in place, bulls likely have every right to feel nervous.
