
S&P 500 (SPY)
It has become increasingly more clear to me in recent days that the stock market rally is far from over. I have become more convinced that the S&P 500 can continue to rally to beyond 2,800. The current rally, although not in a straight line, can extend to over 3,000 and beyond.
Looking to 2020
Despite growth earnings growth in 2019 which is expected to be slower than previously thought, is still expected to grow 4.8% to $169.53 per share. That is down from estimates for growth of 7.6% on December 31 according to Factset. Meanwhile, Factset is currently projecting earnings growth of 11.2% in 2020, which brings 2020 earnings estimates to $188.70.

Valuation Is Too Low
It leaves the S&P 500 trading at roughly 14.7 times 2020 earnings estimates. Which is well below the range of 16 to 17.5 times one-year forward earning the S&P 500 traded at throughout most of 2018. At an earnings multiple of just 16 times 2020 earnings estimates, the S&P 500’s valuation would rise to around 3,020. Given the faster pace of earnings growth projections for 2020, the higher earnings multiple does not seem far-fetched.
During periods of earnings growth since the year 2000 it is not uncommon to see the S&P 500 trading between 15 and 18 times one-year forward earnings estimates. It would suggest at its current valuation the S&P 500 is still slightly undervalued. Even at 15 times 2020 earnings estimates the S&P 500 is worth roughly 2,830.

Guidance Has Been Weak
The big question is if earnings estimates still have further to fall. According to Factset 76% of companies in the S&P 500 have issued first-quarter guidance below expectations for the first quarter.

Of course, that is still the big question on everyone’s mind, will earnings continue to deteriorate. However should earnings stabilize or even recover throughout 2019 and into 2020, then it would suggest that the market is still very undervalued and likely has much further to rise.
Technicals Are Strong
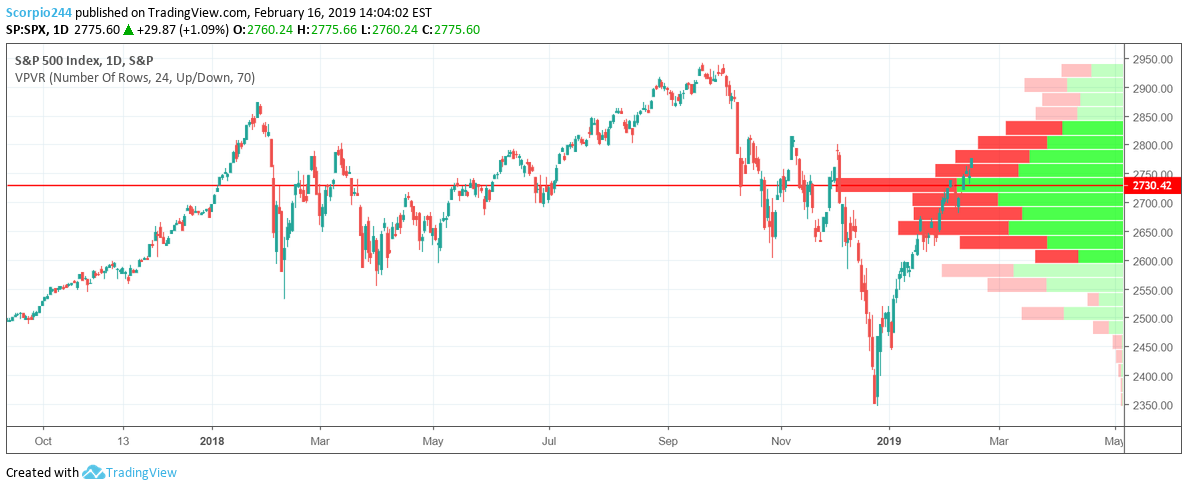
When looking at the technical chart, we see that the index has already past the zone that may have presented the most significant amount of trouble, where the volume amounts were the strongest and suggest that the path of least resistance for the S&P 500 at this point is higher.
Also, consider that the relative strength index has had a significant change in trend over the past few weeks. The chart below shows the rise has recently risen above a downtrend that had been in place since peaking in early 2018.
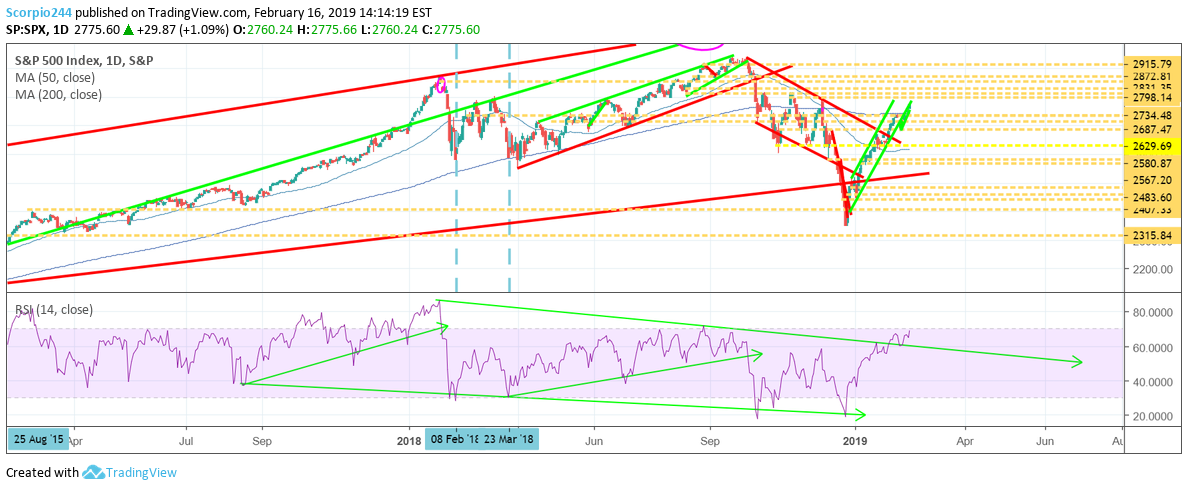
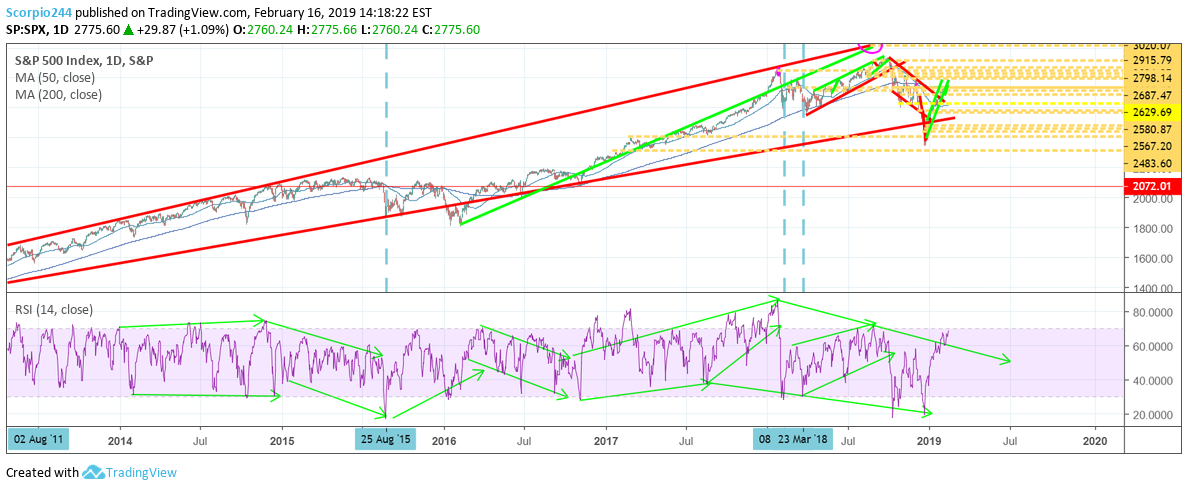
In the past, we can see the S&P 500’s RSI has gone through these shifts before which help to show significant changes in the longer-term trends.
For now, the bears still feel like they are in control, but in reality, that control seems to be slipping away. If they aren’t careful, they are likely to miss the next 8 to 10% of this rally.