How close to its end is this S&P 500 consolidation are we – will the rebound meet its spark? Yesterday's session carries signs of the upcoming move, which I think will be higher. As said yesterday – in the battle of narratives, the corona second wave fears still play second fiddle to the recovery hopes, and especially the many programs that push for it. And Treasury Secretary Mnuchin wants the US economy open even if a severe second corona wave really hits.
Therefore, I think that repairing the real economy damage from the lockdowns, and the grind higher in stocks – sometimes slow, and sometimes not so slow – will go on.
S&P 500 in the Short-Run
Let’s start with the daily chart perspective (charts courtesy of http://stockcharts.com ):

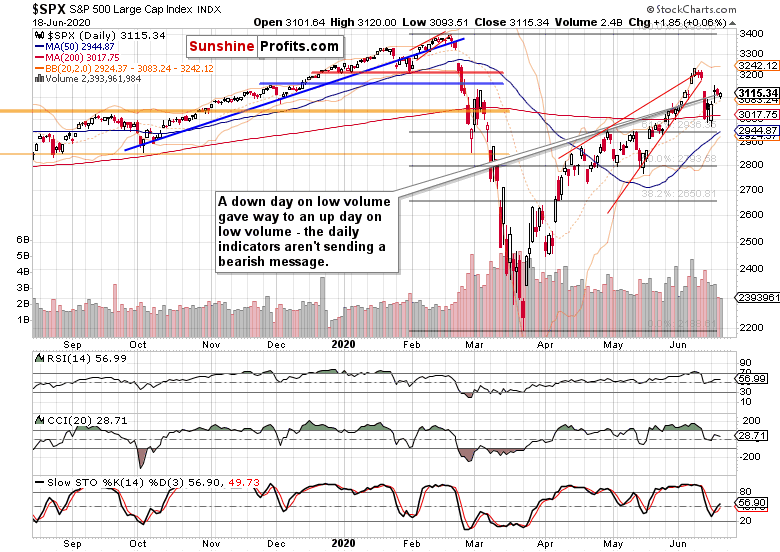
It might seem that not much is happening in stocks, but don't give in to appearances. Stocks couldn't go on declining yesterday, all trading action for two days in a row remains confined by Tuesday's intraday price extremes. With a pinch of salt, that makes for two daily inside candles, with the preceding momentum favoring a break higher above Tuesday's highs.
Neither volume nor the daily indicators are sending a bearish message here. I view these signals as both a short-term indecision and sellers' unwillingness to try driving prices down. This means that the pressure for the upside move is building – the key question is the timing, and optionally a catalyst.
Such were my observations yesterday:
(…) to me, this is just establishing a higher base after yet another decisive Fed move. Make no mistake, buying individual corporate bonds is huge – they can sit on the Fed's balance sheet for as long as the central bank wants them to. After the many instruments on their table already, this is just as close to buying stocks or their ETFs outright as it gets. By the way, Bank of Japan already does that, and the Fed might follow one day."
The daily indicators are positioned constructively for the stock upswing to continue – at this point, I am waving off concerns that they might show bearish divergences by making lower highs next. A pattern in progress is just that – not completed. And besides, the other considerations have the potential to overweigh that.
It appears that the bears won't get too far with the bearish wedge breakout invalidation and the island top reversal – the consequences have overwhelmingly played out already. The summer doldrums in stocks might bring us quite some sideways trading over these months, but this would serve just to build a strong base to catapult stocks higher when they're ready for such a move.
These were my points earlier this week about the momentum:
(…) The speed with which prices cleared the 61.8% Fibonacci retracement, is lending credibility to the bull market thesis. It's not unexpected that a sharp plunge of Thursday's caliber gives way to a brief consolidation that attempts to move the market either way, eventually followed by similarly sharp rebound. That's a fitting description of what we have seen on Monday and yesterday.
And in today's overnight S&P 500 price action, we're already seeing signs of continuing price recovery, which is exactly what I called for yesterday.
So, how did the credit markets finish yesterday's session exactly?
The Credit Markets’ Point Of View

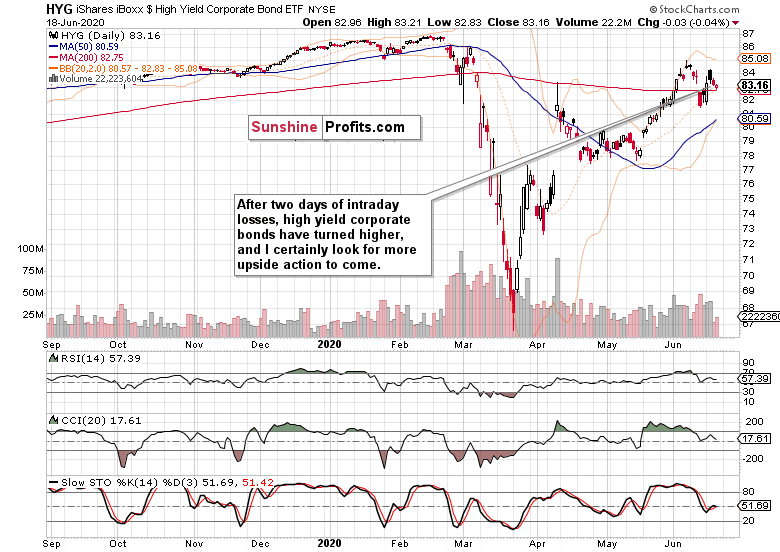
Despite opening with a bearish gap, high yield corporate bonds (HYG) didn’t move any lower yesterday. Quite to the contrary, they scored modest intraday gains, and encouragingly on increasing volume. That looks like base-building before the next upleg to me.

To bring that very short-term perspective into bigger picture, here what we said yesterday:
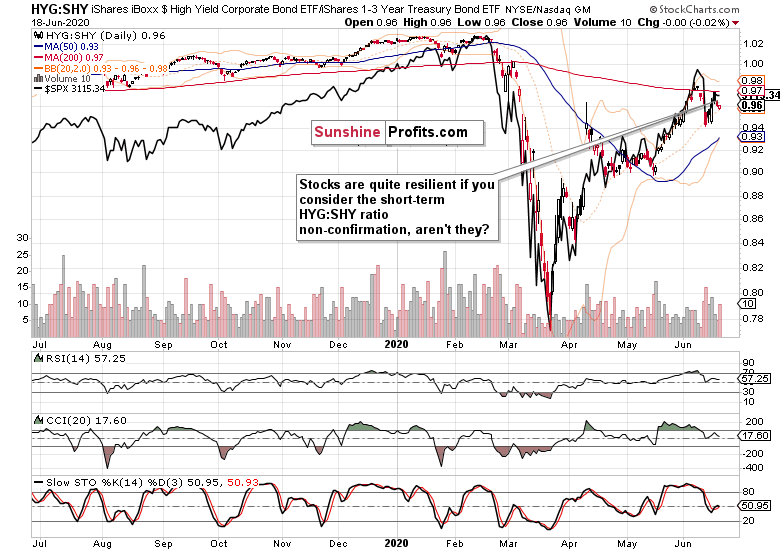
(…) Take a look instead at the sizable early April gap and the trading action that followed next. There were some downside moves, yet amid generally rising stocks. And what about the mid-May non-confirmation as the HYG ETF moved lower while stocks more than held ground? While we're not at such an advanced stage of Monday's Fed move digestion, it pays to remember that lesson already.
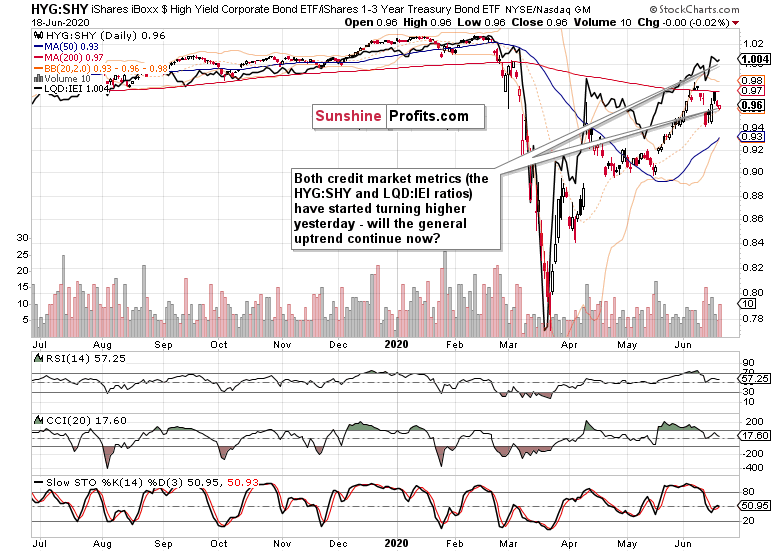
And the continuing premarket trading confirms my thesis that the bulls are reasserting themselves. It might take more than a few sessions before we see some brief, short-term non-confirmation from the credit markets again, which bodes well for both the stock and HYG:SHY ratio upswings to continue in the meantime and feed on each other.

The overlaid investment grade corporate bonds to the not very short-term Treasuries (IEI) confirms that both of these leading credit market metrics are ready to peek higher again, which goes to add to the bullish interpretation of yesterday's HYG:SHY move.
Keeping focus on the fundamental outlook:
(…) In short, the bond markets aren't questioning the recovery storyline, and are still more sensitive to the money spigots than hair-raising corona stories. I'm not arguing for a V-shaped recovery here, I just think that less bad is the new good as stocks are bought amid the prevailing real economy uncertainties (just when and how much will it rebound with some veracity?) and stimulus efforts as far as eye can see.
From the Readers' Mailbag
Q: One concern I have is the bear wedge pattern that everyone uses including yourself. By looking at $SPX closing values I am able to produce a rising channel with parallel lines (28 degrees, 29 degrees) for upper and lower trendlines. They are NOT broken at this point although there were multiple tests. Switch (NYSE:SWCH) to line mode instead of candles. All the indices show this pattern and their ETF's.
A: Rising bearish wedge, rising trend channel – such patterns more often than not resolve with a break lower. The real question is after how much of preceding upswing that happens, and how fast and how strongly / lastingly would the buyers step in. In other words, would the bears achieve some lasting technical turnaround?
When we were trading at the upper border of the bearish wedge, I argued for their fleeting success in moving prices down. And things turned out that way – after Thursday's slide, we got further downside strongly rejected both on Friday and on Monday. Not that the sellers haven't really pushed hard, but the buyers proved stronger (even before the Fed spoke later on Monday).
Reading the technical and fundamental tape, they were favored to win this fight. The narratives (and especially the sensitivity with which the market reacts to their evolution) haven't changed much since.
Even if I draw a rising trend channel based on closing prices with its lower border formed by the May and June closing prices (as you are correctly pointing out), all I would get is another pattern that is apt to get sooner or later a bearish resolution – but again, would that be of lasting consequences? Not until I see some corresponding signs in the meantime.
They aren't there yet, and prices can keep bobbing around and above the channel's lower border, which would just establish a higher base in stocks before the bears get serious about testing the bulls again.
To me, Thursday's waterfall served to spook the bulls just about enough already. The sentiment readings came off, and so did the complacency. Prices can go on their slow grind higher now, because the bears got badly burned on Monday and Tuesday – it'll take time for them to regroup and mount another attack.
That's why I think the time for your rising trend channel will come only later, and not immediately. As I am a momentum / breakout gal, I would seek to draw it using the candlesticks preferably. In the meantime, nothing beats riding a good trend – while we've made quite some easy money already, there's more to come. Far from being a set-and-forget trade, we better keep our guards up as volatility (VIX around these mid-30 levels) is here to stay and test us again despite its deceivingly tame look over the past two sessions.
Q: The market is no longer a rational market where price discovery is relevant. The current market is controlled by the few as their algorithms can think and trade faster than any TA ever will...you currently have the Bull vs Bear thesis being fought out by the Few...as the alto's continue to force the bears into pain...but until the pain becomes unbearable the Bull altos will continue to push this higher...and with Jerome at their beck and call the downside is limited..
Despite the intervention-heavy environment, the price discovery mechanisms are still there – the discounting of various policy steps is a process. And it's not a question of shaving off a few milliseconds to gain an advantage or manipulate the DOM with quickly withdrawn orders. I'm not competing in the HFT arena – it makes no sense – higher time frames offer promising and reliable enough opportunities to trade and profit on both sides as my Performance Page shows. Besides, the profit potential in HFT was much bigger earlier this decade.
You're writing about forcing the bears into pain – yet despite the Powell put argument, they're still willing to take the other side of the trade. They even enjoy a modest degree of temporary success as this week's trading has also shown. Sure, they're expecting to attract more selling, and look to force the price discovery mechanism's pendulum their way. They're behaving rationally when they start selling at what they perceive to be elevated price / bullishness levels. I'm just illustrating that regardless of the interventions, both sides are engaging in price discovery.
Q: Until the FAANMG stocks show a down turn, market is not going be down.. It does not matter what technical analysis show. The 5 big Tech giants have to go down for market to hit lower Fib levels.
A: The S&P 500 is advancing, and the generals are doing great. They're not weakening and the market breadth of the S&P 500 is just right. Conversely, it matters what technical analysis shows – imagine that the generals keep pushing higher while the troops refuse to follow along. That would be a warning sign to me that the S&P 500 is about to roll over.
Technical analysis offers quite a few more tools that the above example to help time the markets, and is by no means irrelevant. And definitely, I can't imagine a scenario where the tech heavyweights would keep trading higher while the S&P 500 was plunging. Technology leads stocks – both on the upside and on the downside.
Summary
Summing up, the risk-on sentiment appears slowly returning to stocks as the credit markets keep further declines in check. This appears to be part and parcel of discounting Monday's Fed move, and I expect the brief non-confirmation of the stock upswing on a very short-term basis to be resolved relatively soon, along the lines of what we've seen with the April $2.3T bombshell already. The leading credit market ratios and sectoral analysis keep pointing in the direction of more S&P 500 gains to come. Buy-the-dip mentality in stocks keeps having the upper hand regardless of the perils and uncertainties, despite the Russell 2000 (IWM ETF) taking a very short-term breather currently.
