A while back I wrote about how investors were using short volatility ETFs. To me, it was like picking up pennies in front of a steamroller. Since then, it’s grown far beyond anything I could have imagined.
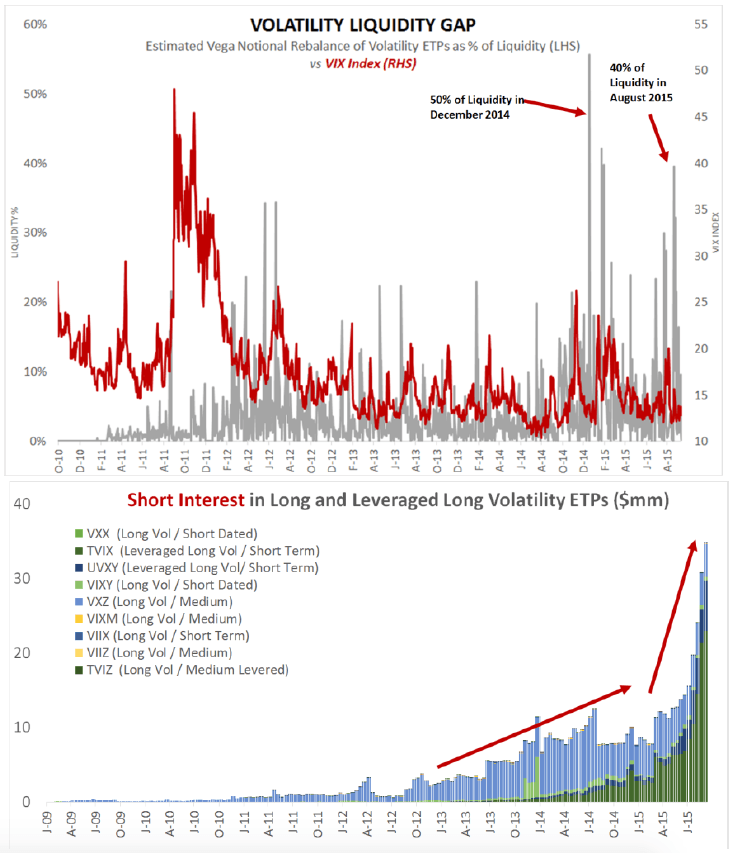
While the assets in short volatility ETFs have remained elevated, the short interest in long volatility ETFs has absolutely exploded. Last October, in a comprehensive piece titled “Volatility and the Allegory of the Prisoner’s Dilemma,” volatility expert Chris Cole quantified this trade in the charts below.

He concludes (emphasis mine):
The bi-polar behavior in spot-VIX over the last year empirically supports the theory that a structural weakness now exists in this market by crowding of short volatility players. The shot across the bow for the short volatility complex came during the August 24th correction when SPX futures opened limit down and the CBOE struggled for 30 minutes to calculate the VIX. By the time the VIX level was finally calculated it opened 25 points higher at 53.29, before falling to 28 intra-day, then rebounding to 40.74 by the close, with the S&P 500 index down -3.9%. At the time of the crash, the assets in long VIX ETPs outnumbered shorts on a two to one basis however, the complex still required an estimated 25% to 46% of market liquidity between August 21 and 24th. Markets delivered historic volatility-of-volatility despite relatively mild historical declines in the S&P 500 index. It is important to understand that markets have experienced much more dramatic one- day losses across history than what occurred in August 2015. For example on August 8th 2011, the market suffered a one- day decline of -6.7%. September to December 2008 experienced ten declines of more than -5%, and on Black Monday 1987, the market fell an incredible -20.5% in one day. During the Black Monday 1987 crash implied volatility in the S&P 100 index more than tripled going from 36.37 to 150.19. If markets experienced any of these historic crashes at current levels of short convexity the entire $2bn+ short volatility ETP complex could potentially be wiped out overnight.
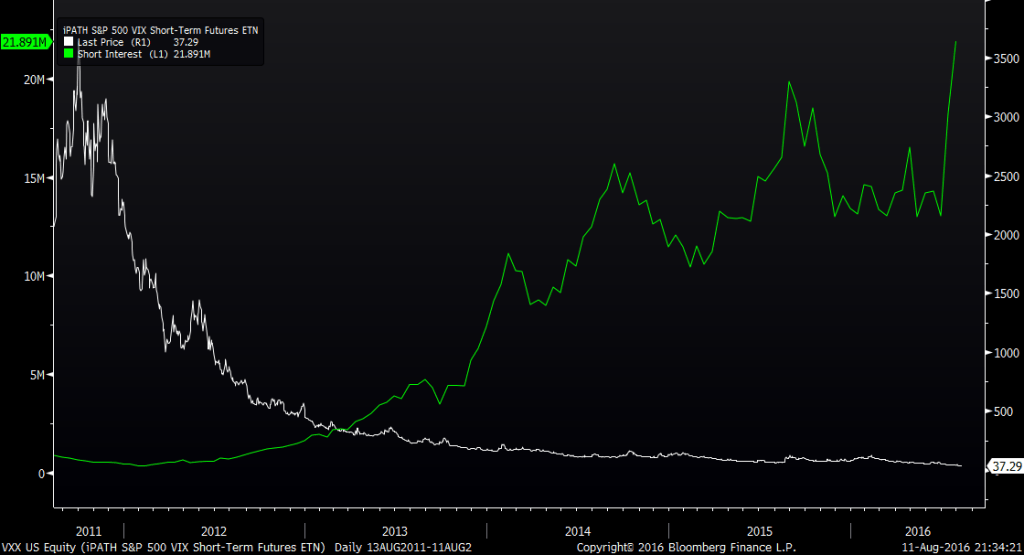
Since Cole wrote this, the trade has only become more crowded. The chart below shows the recent surge in VXX short selling that's taking short interest record highs.

What I find fascinating about this recent surge in the short selling of volatility is that it comes not during a dip or a surge in volatility, as it has in the past, but at a time of new all-time highs in the S&P 500 -- and when the VIX is trading near the very low end of its historical range.
It seems that traders are getting far more aggressive in collecting their pennies.
