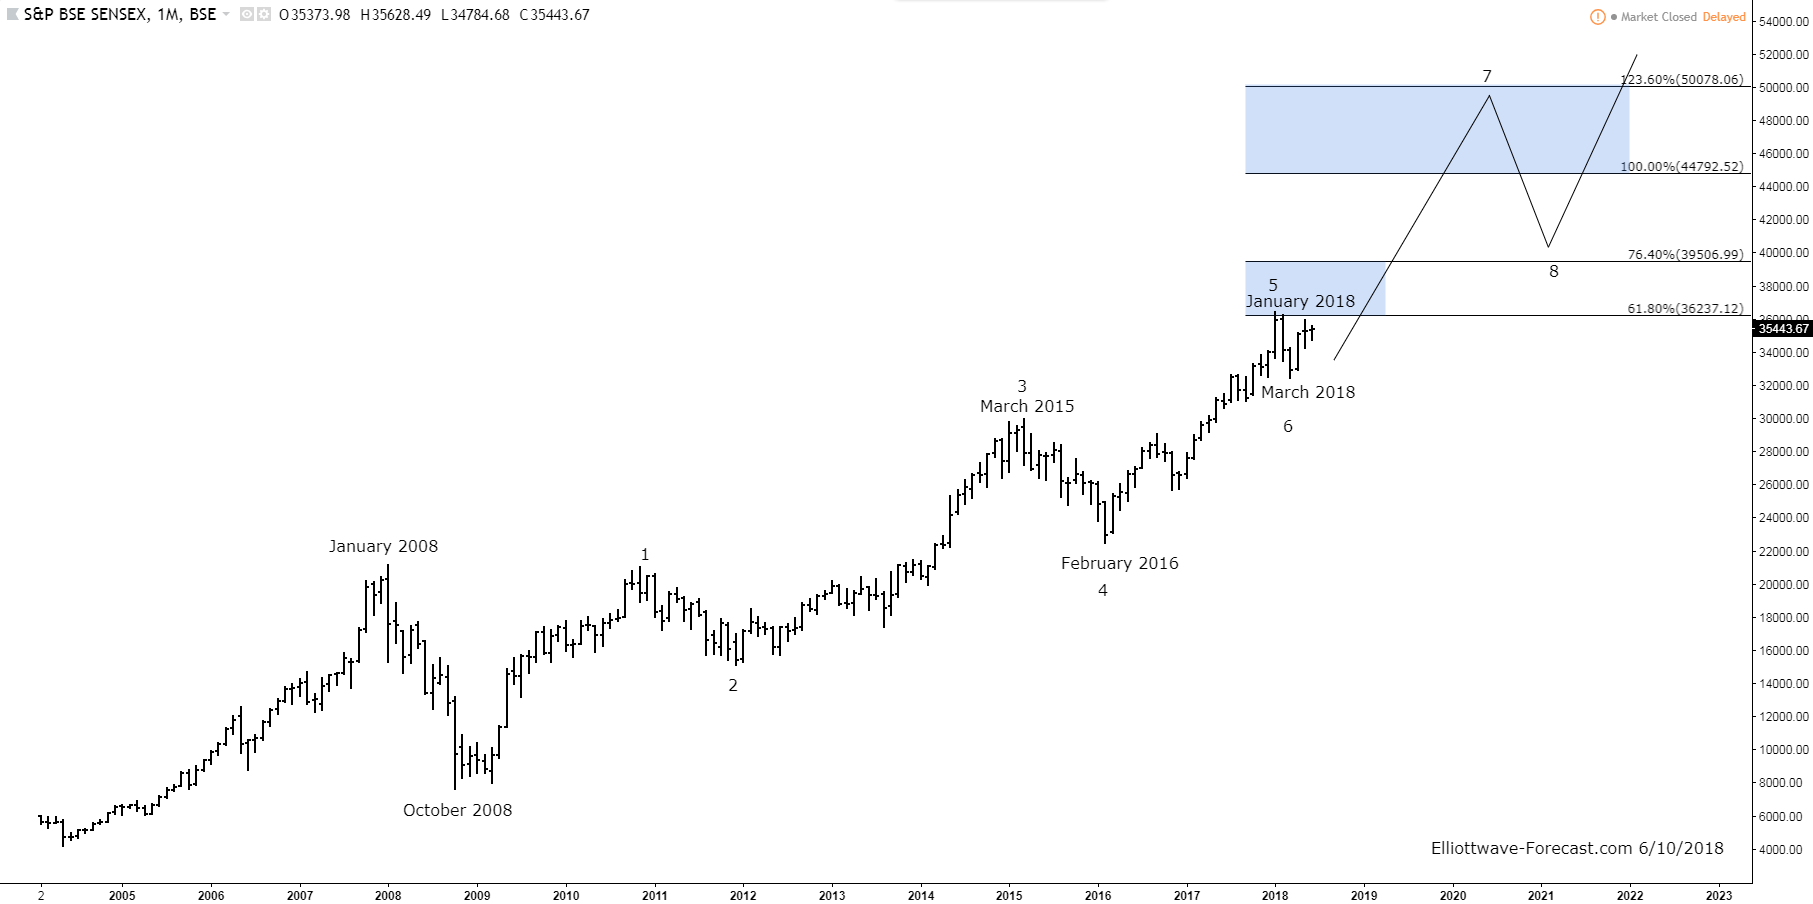
The Sensex Index long-term bullish cycles have been trending higher with other world indices. Firstly in it’s base year 1978 to 1979 the index’s point value was set at 100. From there it rallied with other world indices trending higher into the January 2008 highs. It then corrected the bullish cycle as did most other world indices. It ended that larger degree correction in October 2008. From those 2008 lows, the index shows a 5 swing sequence that favors further upside. Price has reached and exceeded the .618 Fibonacci extension of the 2008 to 2015 bullish cycle.
Secondly, this Fibonacci extension is measured is as follows. Use a Fibonacci extension tool on a charting platform. Point 1 will be at the beginning of the cycle at the 2008 lows. From there on up to the 2015 highs will be point 2. The point 3 will be down at the 2016 lows. As earlier mentioned, the index in January 2018 saw the .618 Fibonacci extension of the 2008 to 2015 cycle. In most cases a fifth swing will end in this .618 – .764 Fibonacci extension area. The analysis continues below the chart.
The currently favored view is the Sensex index dip lower from the 5th swing high ended the cycle up from the 2016 lows. It did a 3 swing pullback to the March 2018 lows to complete the 6th swing. Thus at this point it is favored to remain above there during dips. The most bearish near term case is if it remains below the January 2018 highs it can continue a pullback in the 6th swing in 3 more swings. This would make a possible 7, or 11 swings to correct the cycle up from the 2016 low which should be similar to the 2nd swing pullback of 2011 or the 4th swing of 2016.
In conclusion. Either way while price is above the February 2016 lows the Fibonacci extension areas remain the same. Afterward of completion of the 6th swing pullback it should see more upside in the 7th swing toward the 44792-50078 area.
