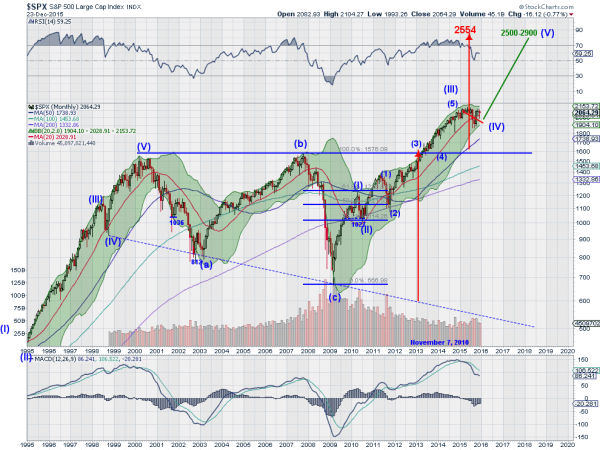
The stock market could use a kick in the pants. This time last year I posted the chart below in this space with some scary Elliott Wave (not really scary) analysis showing that the S&P 500 could move sideways for a long time. It is updated now. I did not know it would be all year!

The important part of this analysis is the last little red line leading to the label (IV). The fourth wave in the Elliott Wave pattern. It is a corrective wave following the strong thrust higher in Wave (III). It is expected to be relatively flat because of the sharp downward nature of Wave (II). But every corrective Wave has an A-B-C pattern to it. A down followed by B back higher and then finally C down.
We certainly experienced the A move lower in August and through September, and likely the B leg back up as the market retraced in October. The remaining question is whether or not the C leg has more time to it. Will the market continue lower in the short term trend as it has since the beginning of November, making a series of lower highs and lower lows? Or will this recent rally turn into more and prove to be the start of Wave (V), moving back higher?
All we can do is watch, manage risk, and react. A good clue to strength would be continuation to a new higher high over 208.50. But it would take a move over 211.66, the November 3rd high, to seal the case for a move higher. And of course a new lower low under 199.83 from last week keeps the C going lower. Until we see evidence enjoy time with family. Have a Merry Christmas and Happy New Year.
