T2108 Status: 72.4%
T2107 Status: 65.7%
VIX Status: 11.7
General (Short-term) Trading Call: neutral
Active T2108 periods: Day #209 over 20%, Day #29 over 30%, Day #28 over 40%, Day #26 over 50%, Day #20 over 60%, Day #2 over 70% (overbought, period ended 4 days under 70%)
Commentary
The S&P 500 (via SPDR S&P 500 (NYSE:SPY)) quickly returned to overbought status, but it crept its way above this threshold in an unimpressive style. T2108, the percentage of stocks trading above their respective 40-day moving averages (DMAs), closed on Friday at 70.4% and on Monday at 72.4%. This entry into overbought conditions pales in comparison to the impressive breakout that launched the last overbought period.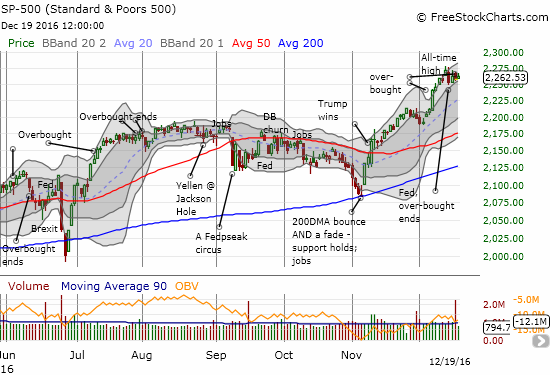
The S&P 500 (SPY) weakened slightly post-Fed but still sits inside the upward trend channel defined by the upper Bollinger Bands (BBs)
When T2108 entered overbought conditions on Friday, the S&P 500 actually closed for a slight loss which represents a bullish divergence. I was not willing to flip the short-term trading call from cautiously bearish to cautiously bullish until I observed the follow-through. The follow-through barely registered with a mere 0.2% gain for the S&P 500.
However, I decided to respect what is likely to be benign trading over the holiday period and switch the short-term trading call to neutral. I also hope to avoid getting churned with a market falling in and out of overbought conditions. Moreover, this move keeps the trading call consistent with the trading strategy for overbought trading where the short-term trading call does not go bearish until the end of the overbought period or upon a pullback from a climactic top pattern.
While the S&P 500 stayed within a calm consolidation range, the volatility index, the VIX, DID make a dramatic move. The VIX lost 4.0% to close at recent lows which are also barely above the low for 2016. This increased complacency is consistent with benign holiday trading (could it even signal the beginning of a Santa Claus rally?).
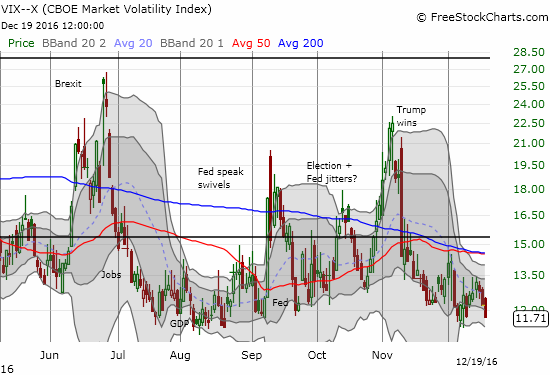
The volatility index, the VIX, fell back toward 2016 lows.
There are a few reasons for my caution and hesitancy to jump on the potential for an extended overbought rally. First and foremost, the reflation trade of the Trump Rally has definitely slowed down and even corrected in many cases. Since December 7th, the day the last overbought rally burst onto the scene, stocks like commodity and industrial Freeport-McMoran Copper & Gold Inc (NYSE:FCX), Caterpillar (NYSE:CAT), United States Steel Corporation (NYSE:X), and CONSOL Energy Inc (NYSE:CNX) have sold off nearly every day sometimes on very heavy volume.
I will focus on their charts in another post. For now, I note that many of these stocks completed full reversals of important breakouts or rallies. I also remind readers that CAT is a key stock for me in gauging the health of a bull run. While I duly bought into some of these pullbacks as I explained I would do in an earlier post, I have now put that program on pause as I wait for signs of life like a successful test of key support lines and trends.
There are also the likes of SPDR S&P Retail (NYSE:XRT) which started corrections one day after the last overbought period began. XRT even gapped down on the first day of the current overbought period.
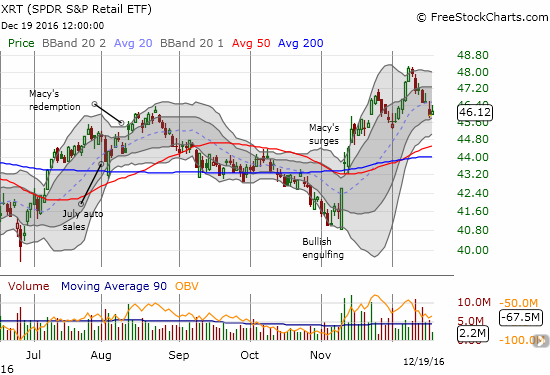
SPDR S&P Retail ETF (XRT) has nearly lost all its gains for December despite the looming promise of holiday shopping and a Santa Claus rally.
Finally, the U.S. dollar index (DXY0) looks like it regained its post-Fed muscle. While dollar strength has been celebrated as a proxy for American economic strength, I strongly expect that very soon continued strength will once again become feared for its potential to hurt American exports and send commodity prices spiraling back downward.
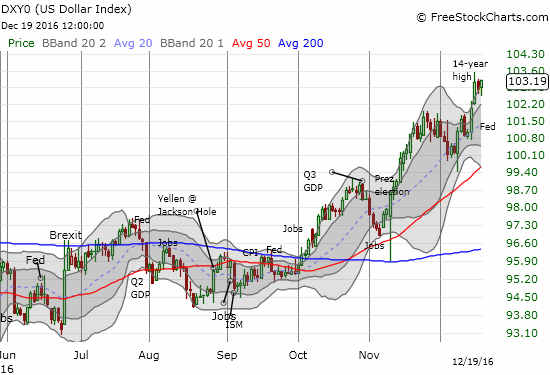
The U.S. dollar index (DXY0) closed at a new (marginal) 14-year high as another overbought period gets revved up.
Daily T2108 vs the S&P 500
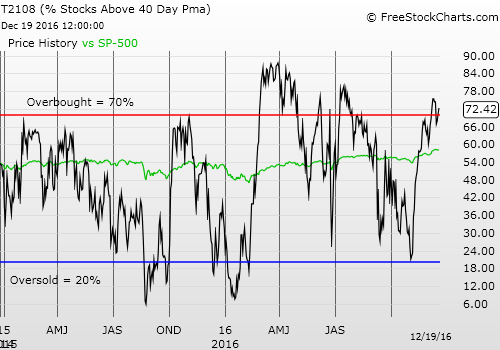
Black line: T2108 (measured on the right); Green line: S&P 500 (for comparative purposes)
Red line: T2108 Overbought (70%); Blue line: T2108 Oversold (20%)
Weekly T2108
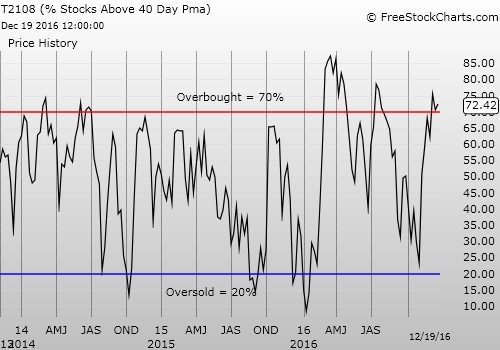
Be careful out there!
Full disclosure: mixed positions on the U.S. dollar, long CAT call and put options, long call options on X, CNX, and FCX
