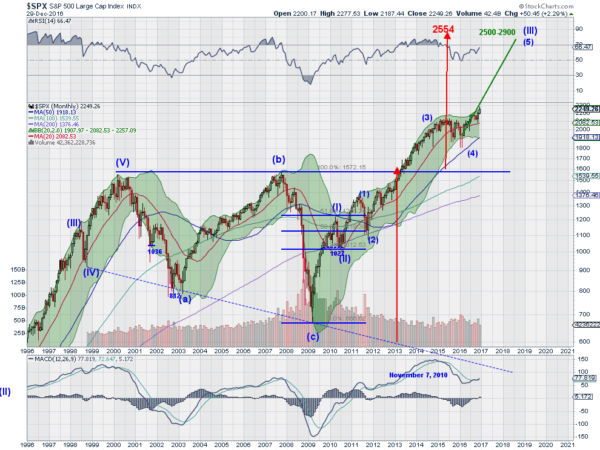
With just 1 trading day left in 2016, the S&P 500 has had a great year. Since making a low in February it is up almost 25%, the move since December 31 is still 10%. After the first 3 weeks, this was quite unexpected and a great reversal higher. But 2016 is in the past. So what's in store for 2017? The long-term chart below has been my guide for the last 6 years. And it looks great going forward.
Four Points
This chart shows the S&P 500's monthly price action over the last 21 years. There are 4 major pieces of information to highlight in the chart. The first is momentum indicators, which are in bullish ranges and improving. The MACD at the bottom found a bottom in January in positive territory and started back higher in June. It is now crossing up -- a buy signal. The other momentum indicator, the RSI at the top of the chart, bottomed in February at the mid line in bullish territory and started higher in March. It is continuing to the upside. Momentum is strong.

The second piece is the Bollinger Bands®. These are a measure of volatility and can often foretell direction as a band of possible prices over time. These Bollinger Bands are opening to the upside. They started this move in June and price is now following the upper band higher. Another indicator in the plus column.
The third is a long-term break out of an expanding triangle that covered 1999 to 2013. This break gives a target to 2554. This move does not have to happen in 2017. It can take longer. But it is also above all Wall Street estimates for 2017, which I take as a good point. No one is expecting a move of only 13% in 2017? Hmmm.
The final piece is the most complicated, an Elliott Wave count. The remnants of a 5 wave count are shown as the top in 2000. That was followed by a corrective A-B-C wave that made a bottom in 2009. It is what has happened since then that is of interest now. A new 5 wave motive pattern higher commenced off of the 2009 low. After an initial Wave I higher into 2010 it pulled back in Wave II, a shallow dip.
From there Wave III started with its own 5 wave sub structure. A first Wave 1 to mid 2011 was followed by a pullback to the November 2011 low as Wave 2. Wave 3, often the longest wave, then took off to the upside. It ended in June 2015 and was followed by another corrective Wave 4 ending in February 2016. Wave 5 would end Wave III to the upside. From Fibonacci extensions this could come between 2500 and 2900. Two targets to 2500 or more. But that is just Wave III. Wave IV following it would be corrective and then a Wave V higher could look for a move well over 3000.
