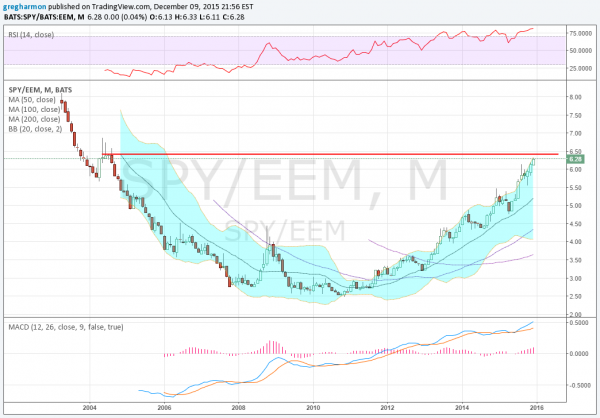
The Emerging Markets ETF (N:EEM) debuted over 10 years ago and from day 1 started taking money from the US Markets. This was seen as a sign of increased risk taking. Investors taking on the risk of Emerging markets at the expense of domestic markets. That shift in capital peaked in early 2008 and bumped higher. Hmm, what else happened at that peak. Oh yeah, the financial crisis.
Keep that in mind when your friends start talking about the next crash. At least this measure of risk is as far away from frothy as can be. But the ratio of the S&P 500 to the Emerging Markets is at an important juncture. The 2004 peak, is coming up shortly at the ratio of 6.50.

The chart shows a steady move higher since 2009. Favoring the discounted US equity market over the emerging markets. This has created a rounded bottom and is now verging on a Cup. Should it power through 6.50 then a retracement to 8.00 is in the cards. A stall and formation of a Handle to go along with the Cup would give an even more lucrative target near 10.50. Only a fall back below 4.50 would negate that.
The momentum indicators show real strength, which would support more upside. The RSI is running very strong at 81. On a daily chart this could be viewed as overbought but the monthly is a real strength. The MACD continues to rise as well but is only at 0.50. Lots of upside room.
What does this mean? Certainly the ratio can go higher from Emerging markets falling further. And a strong US dollar could facilitate that in the short run. But a pause and run higher in the US markets is another way this could play out.
DISCLAIMER: The information in this blog post represents my own opinions and does not contain a recommendation for any particular security or investment. I or my affiliates may hold positions or other interests in securities mentioned in the Blog, please see my Disclaimer page for my full disclaimer.
